

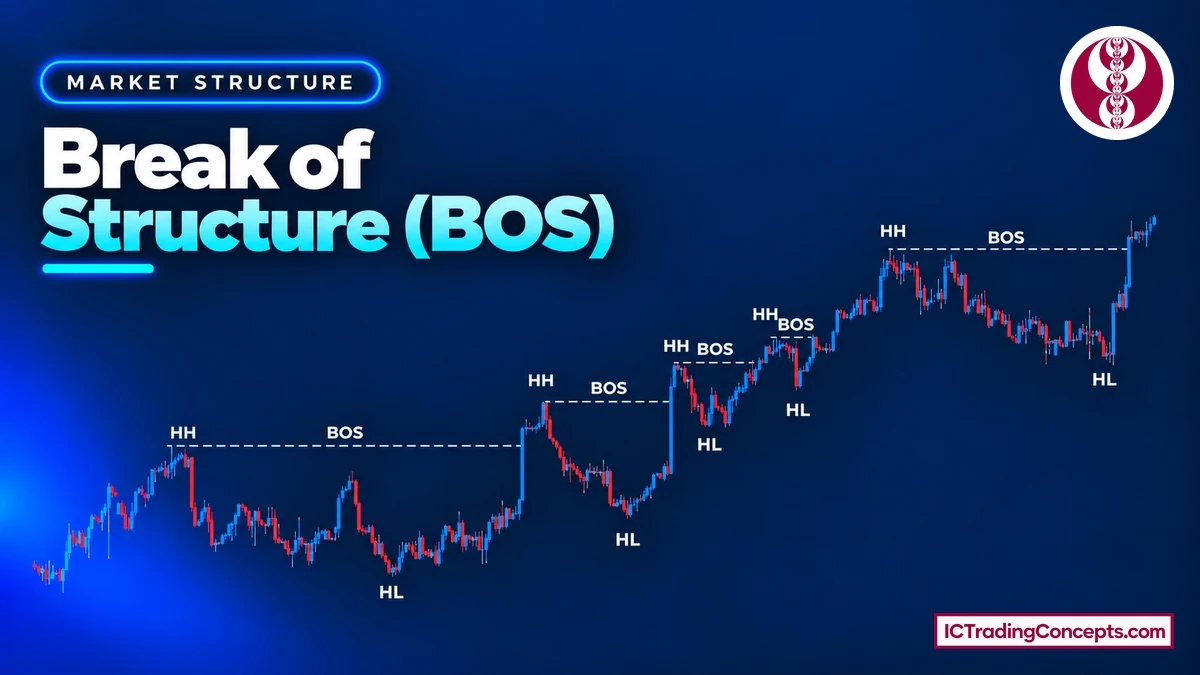
A Break of Structure (BOS) is a Smart Money Concepts (SMC) term for the moment price confirms that the current trend will continue. A bullish BOS forms when price makes a higher low and then a higher high, with a candle body closing above the previous high. A bearish BOS forms when price makes a lower high and then a lower low, with a body closing below the previous low. A BOS is a confirmation, not an entry or exit signal.
Key Takeaways
- BOS meaning in trading: a confirmation that the trend will keep moving in its current direction.
- A bullish BOS needs a higher low first, then a higher high. A bearish BOS needs a lower high first, then a lower low.
- Only a candle body close beyond the swing, on the timeframe you use for structure, confirms a BOS. A wick does not count.
- Mark structure with external highs and lows. Internal highs and lows inside them do not count.
- A BOS is a confirmation, not an entry or exit point. A change of character (CHoCH) is the first warning that the trend may be reversing.
What Does Break of Structure (BOS) Mean in Trading?
BOS stands for Break of Structure. It is a Smart Money Concepts (SMC) term that price action traders use to confirm that an asset's trend will keep moving in its current direction: a bullish BOS points to further upside, and a bearish BOS points to further downside.
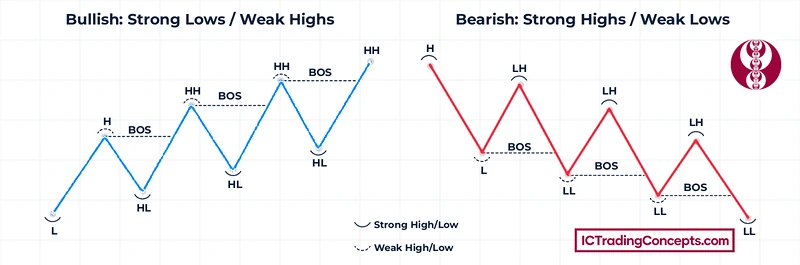
Market structure is the sequence of swing highs and swing lows on a chart. In an uptrend, price makes higher highs (HH) and higher lows (HL). In a downtrend, it makes lower highs (LH) and lower lows (LL). A BOS is the step that extends that sequence:
- Bullish BOS: price makes a higher low, then a higher high.
- Bearish BOS: price makes a lower high, then a lower low.
So when traders ask what is break of structure in trading, the short answer is: it is the market's confirmation that the trend has not finished yet.
How a Break of Structure Forms
A BOS confirms a trend that already exists, so it needs a sequence of higher lows and higher highs, or lower highs and lower lows, before it can print. The order matters: the pullback swing comes first, the break comes second.
Bullish Break of Structure
A bullish BOS forms in an uptrend. Price pulls back to a higher low that stays above the previous low, then rallies and closes above the previous high with a candle body. That close confirms the higher high and shows that the uptrend is continuing.
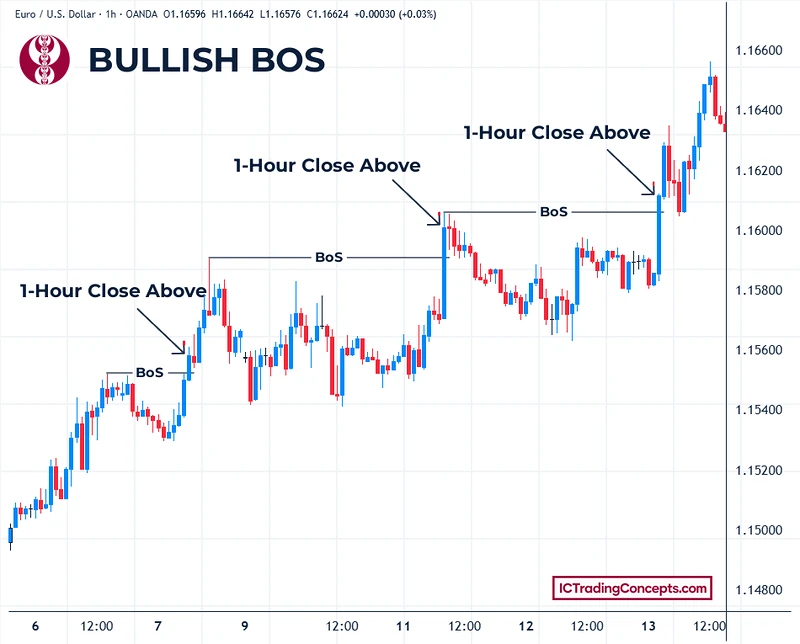
After the break, the higher low that launched the rally is the strong low: the level that should hold for the uptrend to stay valid.
Bearish Break of Structure
A bearish BOS is the mirror image in a downtrend. Price rallies to a lower high that stays below the previous high, then sells off and closes below the previous low with a candle body. That close confirms the lower low and shows that the downtrend is continuing.


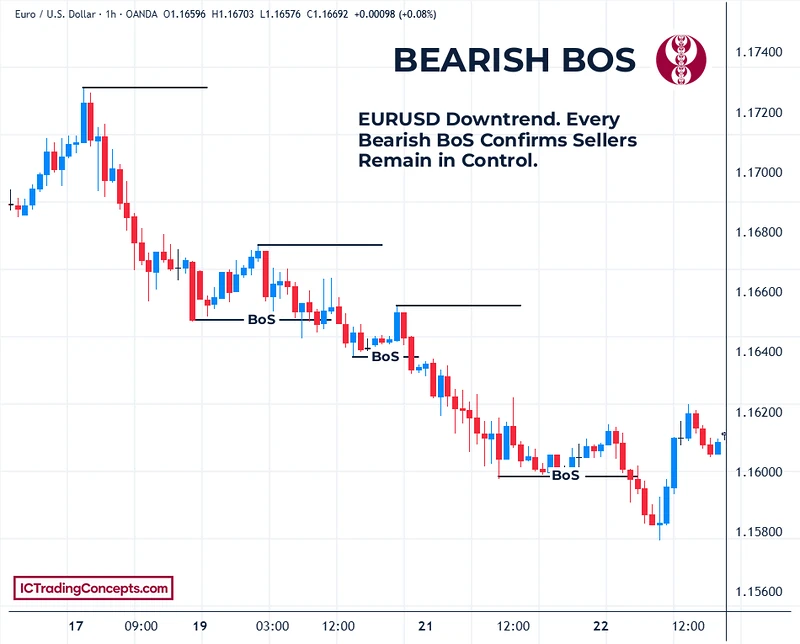
The lower high that started the drop is the strong high: the level that should hold for the downtrend to stay valid.
How to Identify a Break of Structure (Step by Step)
Identifying a break of structure comes down to reading the right swings on one chart and waiting for the right kind of close.
- Pick one structure timeframe. Use an intraday chart, for example the 15-minute, and read the trend there: HH and HL, or LH and LL.
- Mark the external swings. These are the swing highs and lows that define structure on that timeframe. Ignore the internal highs and lows inside them.
- Check the order of the swings. A bullish BOS needs a higher low first, then a break of the last high. A bearish BOS needs a lower high first, then a break of the last low.
- Wait for a body close beyond the swing. The close must come on your structure timeframe: a 15-minute close for 15-minute structure. A wick does not count.
- Update the swings. After the BOS, the new high (or low) is the next weak swing, and the swing that started the move is the strong swing that has to hold.
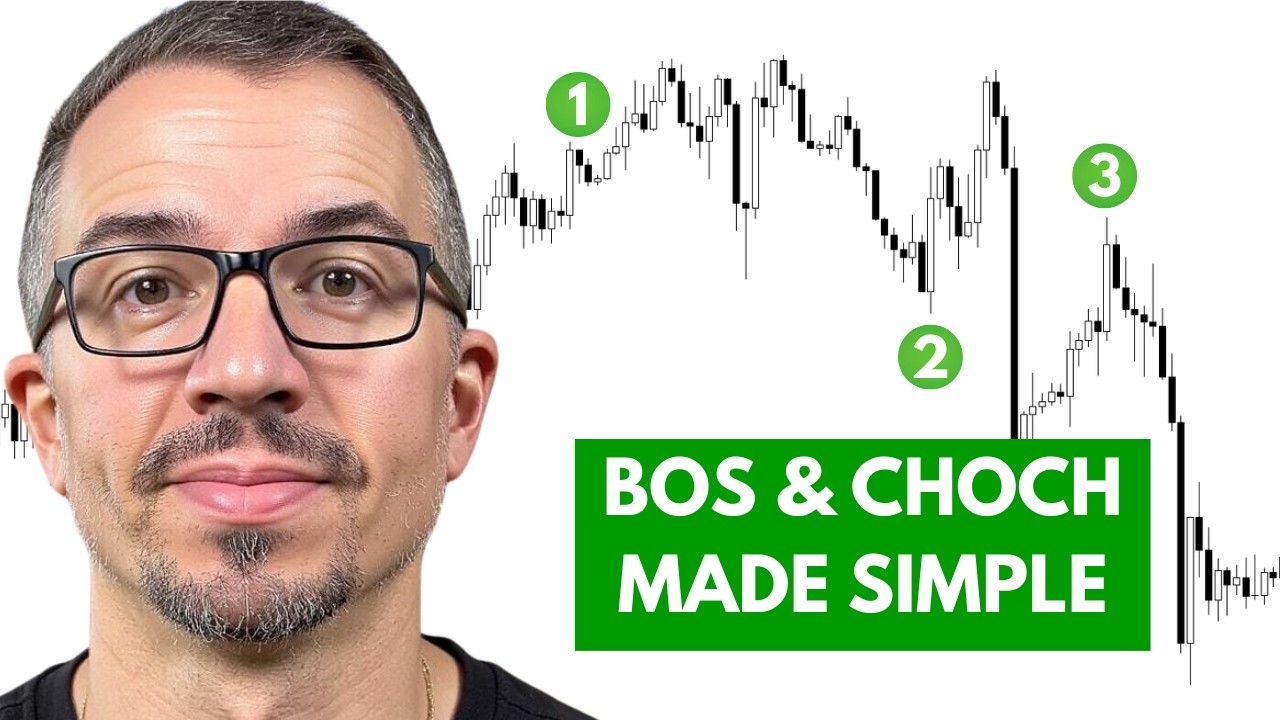
The video below covers internal and external highs and lows, choosing one timeframe for structure and the difference between BoS and CHoCH.
Strong vs Weak Swing Points in a BOS
Every trend has one swing that protects it and one that is expected to break. Knowing which is which tells you what a BOS should take out and what it should leave alone.
- Uptrend: the strong low is the higher low that produced the last bullish BOS. It is likely to hold if price returns to it, and it should not be breached for the uptrend to stay valid. The weak high is the latest high, the level a continuation is expected to take out.
- Downtrend: the strong high is the lower high that produced the last bearish BOS. The weak low is the latest low.
A BOS breaks the weak swing. A break of the strong swing is a different event: a change of character (CHoCH), covered below.
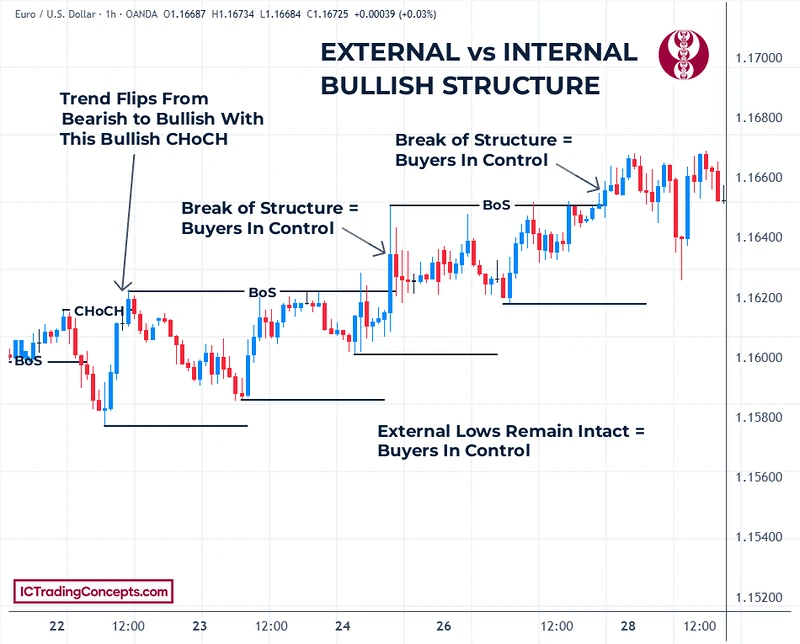
External vs Internal Structure
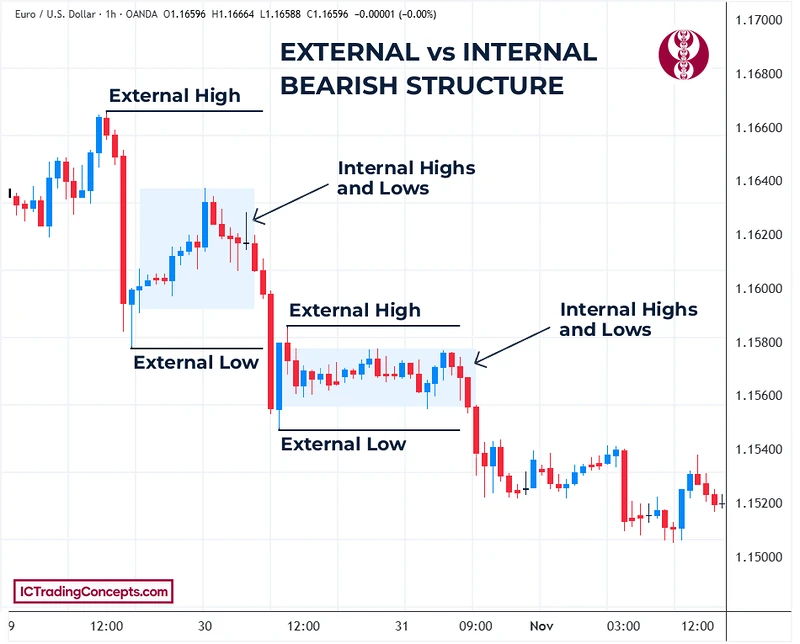
Every timeframe has two sets of swing points. External highs and lows are the swing points that define structure. Internal highs and lows are the smaller swings that form inside them, and they are only noise on your structure timeframe.
- External structure: the swing highs and lows you use to mark a BOS or a CHoCH.
- Internal structure: the highs and lows inside a pullback or a consolidation between external swings. On your structure timeframe, they do not count as a BOS or a CHoCH.
As long as the external lows hold in an uptrend, buyers stay in control, whatever the internal swings do.
In a downtrend the roles flip. The external high and external low frame the range, and the small highs and lows inside each bounce or consolidation are internal structure. Only a close below the external low is a bearish BOS; breaks inside the shaded ranges do not count.


What Makes a Break of Structure Valid?
A valid BOS has three parts: the right order of swings, an external swing and a candle body close beyond it. Remove any one of them and there is no BOS.
The order comes first. In a bullish BOS, the pullback must hold above the previous low (a higher low) before price closes above the high. If price first drops below that low, the higher low has failed and there is no bullish BOS. If price rallies but never closes above the high, the higher high has failed. Neither one is a bullish BOS.
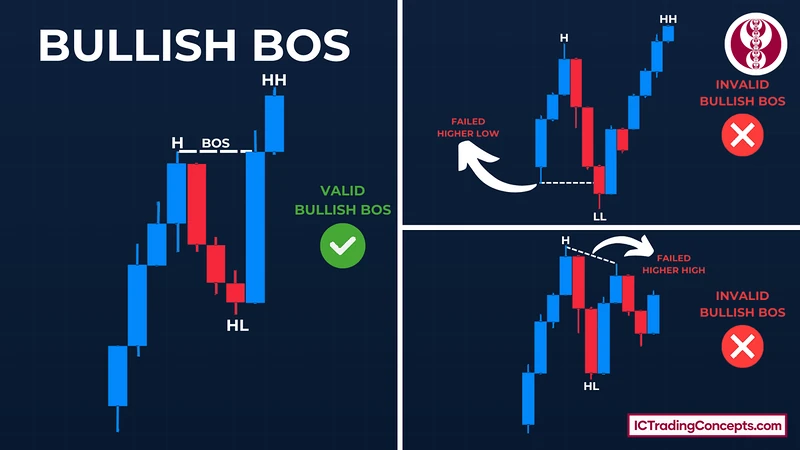
The bearish side mirrors this. The rally must stay below the previous high (a lower high) before a body closes below the low. A rally above that high is a failed lower high, and a drop that never closes below the low is a failed lower low.
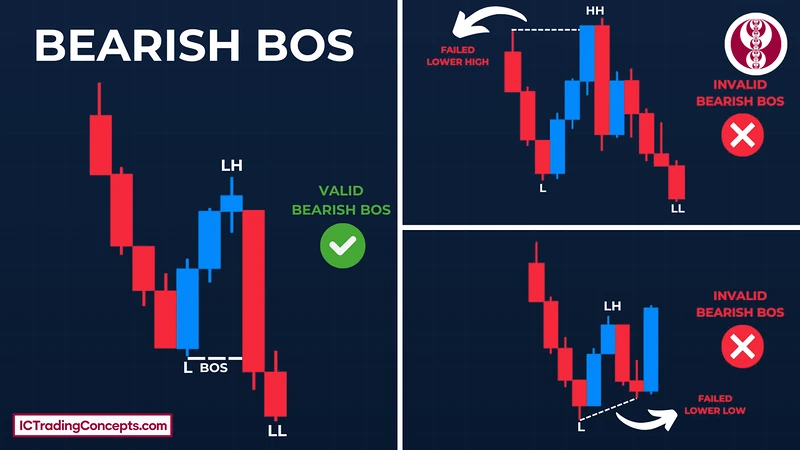
The close decides the break. If price trades through the swing with a wick but the candle closes back inside, there is no BOS. The close that counts is on the timeframe you used to mark structure.
| Check | Valid BOS | Not a BOS |
|---|---|---|
| Swing order | HL then HH, or LH then LL | The higher low or lower high fails first |
| Swing | An external swing | An internal swing inside the pullback |
| Break | Candle body closes beyond the swing | Wick through, close back inside |
| Direction | Same direction as the trend | Against the trend (that is a CHoCH) |
Why a Break of Structure Matters
The idea behind a BOS is liquidity. Traders who join a trend place stop orders for their stop losses and take profits. In a rising stock, buyers who want a better price stop chasing it, so price pulls back and runs into those stops. The triggered sell orders give the waiting buyers the liquidity to enter at a lower price, and if price then pushes above the previous high, the pullback low becomes the higher low and the new high becomes the higher high.
The same logic shows what a BOS rules out. Picture a stock that climbs from $10 to $15, pulls back to $13 and then rises to $17: $13 is the higher low and $17 is the higher high. If price had fallen back below $10, buyers would clearly not want the stock above that level, so an uptrend would be unlikely. If price had failed to get past $15, buyers would not want it any higher, so continuation would be unlikely. That is why both the higher low and the higher high must form for a bullish BOS.
BOS vs CHoCH: Continuation or Reversal?
Both terms describe price breaking a swing point. The difference is which swing breaks and in which direction.

| Concept | What breaks | Direction vs trend | What it signals |
|---|---|---|---|
| BOS (Break of Structure) | The weak swing: the last high in an uptrend, or the last low in a downtrend | With the trend | Continuation |
| CHoCH (Change of Character) | The strong swing that produced the last BOS | Against the trend | Possible reversal |
| Wick through a swing | Any swing, touched by a wick without a body close | Either | No change in structure |
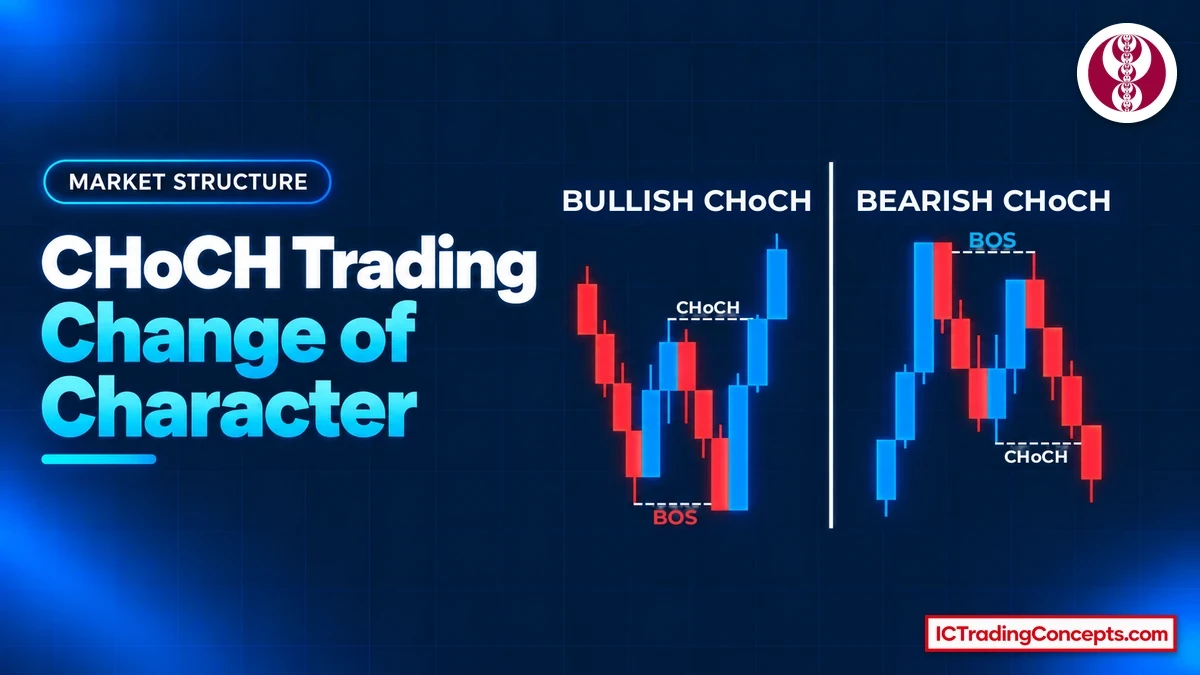
A BOS continues the trend; a CHoCH is the first break against it and the first warning that the trend may be reversing. In an uptrend, a bullish BOS is a body close above the last high, while a bearish CHoCH is a body close below the higher low that produced the last BOS. In a downtrend the roles flip: a bearish BOS closes below the last low, and a bullish CHoCH closes above the lower high that started the last drop. Internal highs and lows do not count for either.
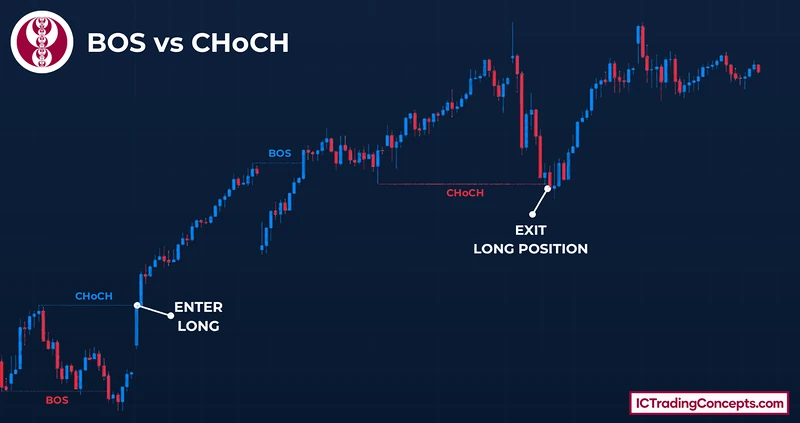
A run of BOS prints keeps the trend in place. The first CHoCH puts it in doubt, and a BOS in the new direction confirms the change.
How BOS Trading Works in Practice
A BOS is not used as an entry or exit point. It is used as confirmation that the current market structure will continue. When a bullish BOS forms, traders who are already long keep their positions instead of selling. When a bearish BOS forms, traders who are short stay in their trades, because the BOS signals that the move is continuing.
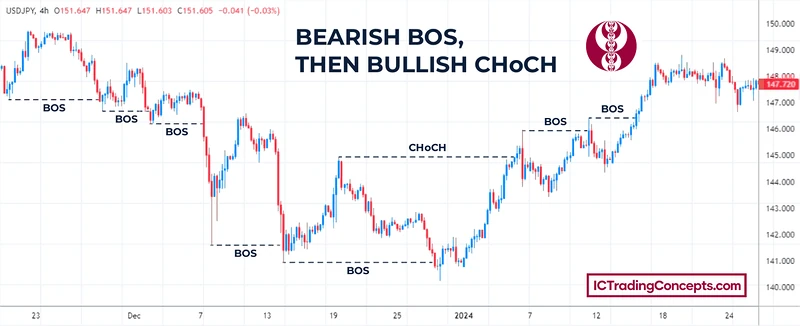
A common way to use a BOS is to pair it with a change of character. In the chart above, a long is opened when a bullish CHoCH forms, the first sign that the downtrend may be ending. The bullish BOS that follows confirms the new uptrend, so the position stays open. The long is closed when a bearish CHoCH forms, the sign that the uptrend may be reversing.
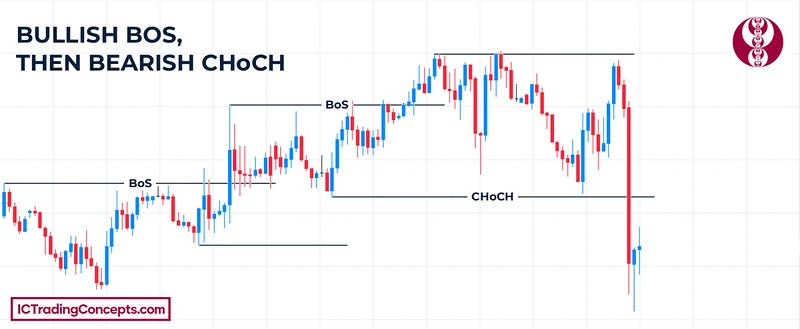
The bearish side works the same way in reverse. A series of bearish BOS prints confirms that a downtrend is continuing, so short positions stay open. The first bullish CHoCH is the warning that the downtrend may be over and, in this approach, the point where a short is closed. A bullish BOS after it confirms the new uptrend.


Choosing Timeframes and Markets
A break of structure works the same way on any chart, but where you use it still matters.
Which Timeframe Should You Mark Structure On?
A BOS is used on intraday timeframes, meaning charts below one day. The most common timeframes for SMC concepts are the 30-minute, 15-minute and 5-minute charts. Pick one of them to define structure and read every swing and every close on that same chart.
Which Markets Show Clear Structure?
BOS works best on markets that large institutions trade actively: stocks, cryptocurrencies and futures. Within stocks, S&P 500 names with a relatively high daily trading volume are a good place to start.
Common Mistakes When Marking Structure
Most BOS errors come from marking the wrong swing or giving the break a job it does not have.
- Counting a wick as a break. A wick through the swing that closes back inside is not a BOS. Wait for the body close.
- Marking internal swings as structure. Small swings inside a pullback do not count. Mark external highs and lows only.
- Using the BOS as an entry or exit. A BOS confirms the trend; it is not a signal to buy or sell at the break.
- Closing a position because a BOS printed. A bullish BOS is a reason for a long to stay open, not to take it off, and a bearish BOS is a reason for a short to stay open.
- Confusing BOS with CHoCH. A break with the trend is a BOS; the first break against it, through the strong swing, is a CHoCH. Mixing them up flips the read of the trend.
Indicators That Mark Structure Automatically
Indicators can map the swings and label each break of structure for you, which saves time when reviewing many charts. Before you rely on a label, check that it sits on an external swing and that the candle closed beyond it with its body.
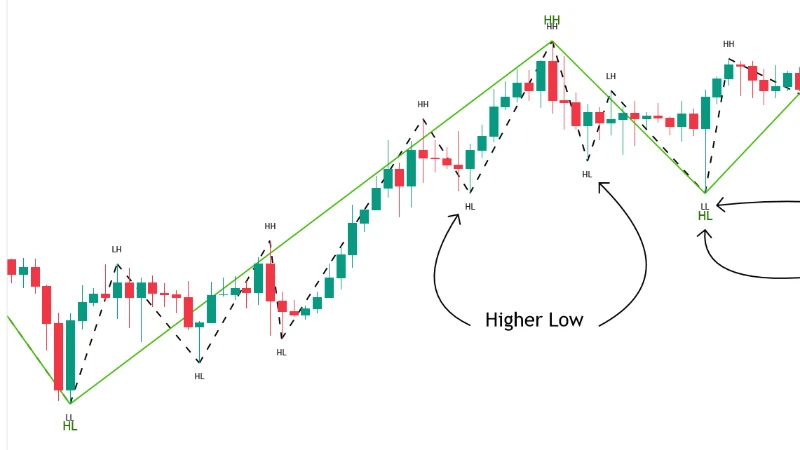
ZigZag Multi [TradingFinder] Trend & Wave Lines - Structures
Connects alternating swing highs and lows, with a long-term zigzag for the main trend and a short-term zigzag for the smaller waves, so the HL-then-HH or LH-then-LL sequence is easier to read before you mark a BOS.
View on TradingView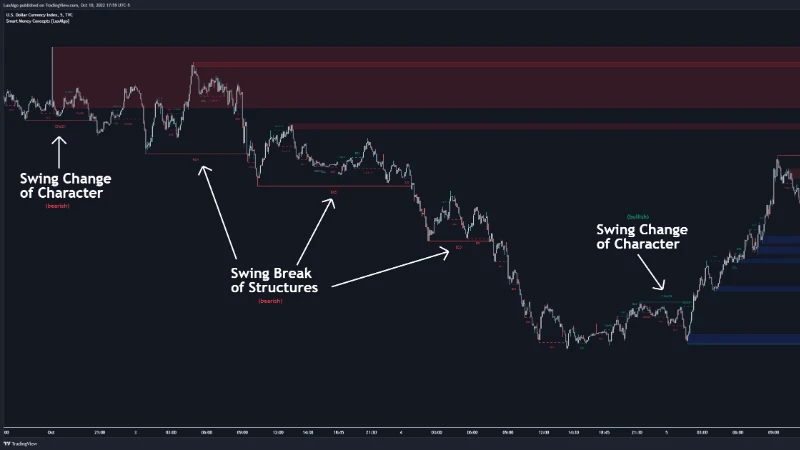
Smart Money Concepts (SMC) [LuxAlgo]
Labels BOS and CHoCH in real time for both internal and swing structure.
View on TradingView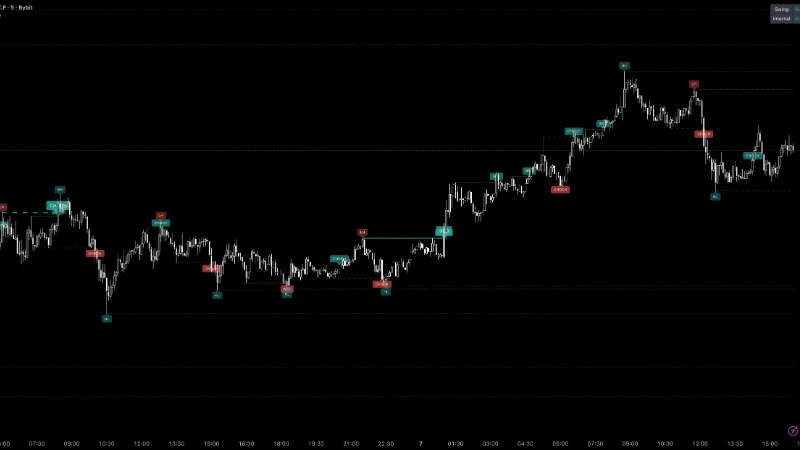
Market Structure (BOS / CHOCH), Advanced & Improved
Labels BOS and CHoCH from one trend state, for swing and internal structure.
View on TradingViewTest Your Break of Structure (BOS) Knowledge
Eight quick questions on the swing order, the body close, strong and weak swings, external structure and how a BOS is used. Each answer links back to the section that explains it.
ABCD Answer with your keyboard
-
01What does a bullish BOS need, in this order?
The pullback swing comes first: price must hold a higher low, then a candle body must close above the previous high to confirm the higher high. A lower high followed by a lower low is the bearish version. Review: How a Break of Structure Forms
-
02On your 15-minute structure chart, price wicks above the last high but the candle closes back below it. What is it?
A wick through the swing that closes back inside does not change structure. The close that counts is a body close on the timeframe you used to mark structure. Review: What Makes a Break of Structure Valid?
-
03In an uptrend, which swing is the strong low?
The strong low is the higher low that launched the last bullish BOS, the level that should hold for the uptrend to stay valid. The latest high is the weak high that a continuation is expected to take out. Review: this section
-
04A small low inside a pullback breaks while the external lows hold. What does this mean on your structure timeframe?
Internal highs and lows are the smaller swings inside a pullback or consolidation. Only external swings count for a BOS or a CHoCH, so as long as the external lows hold, buyers stay in control. Review: this section
-
05What is the difference between a BOS and a CHoCH?
A BOS takes out the weak swing in the trend's direction and signals continuation. A CHoCH breaks the strong swing that produced the last BOS, against the trend, and is the first warning of a possible reversal. Review: BOS vs CHoCH: Continuation or Reversal?
-
06How is a BOS used in a trade?
A BOS confirms the trend; it is not an entry or exit point. A bullish BOS is a reason for a long to stay open, and a bearish BOS is a reason for a short to stay open. Review: How BOS Trading Works in Practice
-
07A stock climbs from $10 to $15, pulls back to $13, then rises to $17. Which levels are the higher low and the higher high?
The pullback held at $13, above the $10 low, so $13 is the higher low. The rise past $15 to $17 makes $17 the higher high, and together they form a bullish BOS. Review: Why a Break of Structure Matters
-
08On which timeframes is a BOS most commonly read for SMC concepts?
A BOS is used on intraday charts, and the 30-minute, 15-minute and 5-minute are the most common. Pick one of them for structure and read every swing and close on that same chart. Review: this section
Review your answers
Conclusion
A Break of Structure is the market confirming its own trend: a higher low followed by a body close above the last high in an uptrend, or a lower high followed by a body close below the last low in a downtrend. Mark it on one intraday timeframe, use external swings only and ignore wicks. Treat the BOS as the confirmation that keeps a position open, not as an entry or an exit; the change of character is the first warning that the trend may be turning.
Sources
- List of S&P 500 companies: Wikipedia
- SMC market structure, BoS vs CHoCH made simple: Justin Bennett, YouTube
Be the first to share your thoughts on this article.