

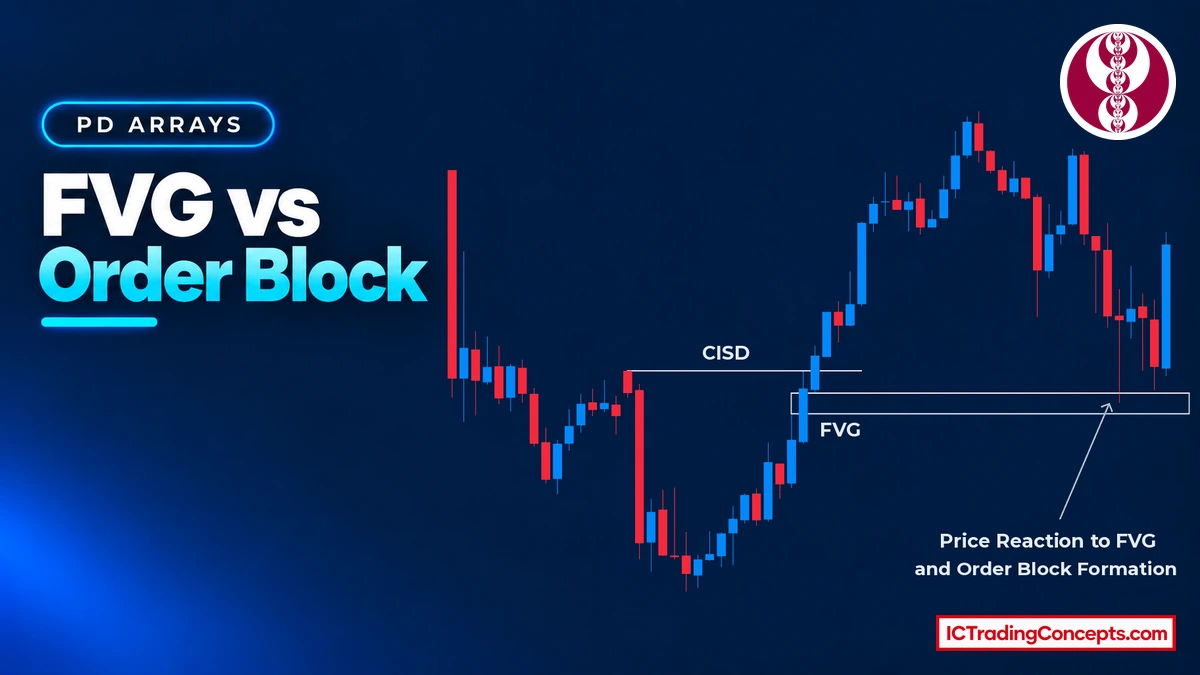
An order block is the last opposing candle before a strong move, and a fair value gap (FVG) is the three-candle imbalance that the same move leaves behind. The order block marks where the move started. The FVG marks where price moved too fast inside the move. In a bullish setup the FVG sits above the bullish order block, and in a bearish setup it sits below the bearish order block, so on a pullback price reaches the FVG first. FVGs tend to hold in strong trends with shallow pullbacks, order blocks tend to matter more at reversals and in ranges, and the lower timeframe tells you which one is actually holding.
Key Takeaways
- The order block forms first; the FVG forms in the displacement that follows it.
- Bullish: FVG above the order block. Bearish: FVG below the order block. Price has to pass the FVG to reach the order block.
- The FVG gives a shallower entry that fills more often; the order block gives a deeper entry with a better price that can be missed.
- Consequent encroachment is the 50% level of an FVG; mean threshold is the 50% level of an order block.
- When the two zones stack on top of each other, they read as one area with two reasons to hold.
What Is a Fair Value Gap (FVG)?
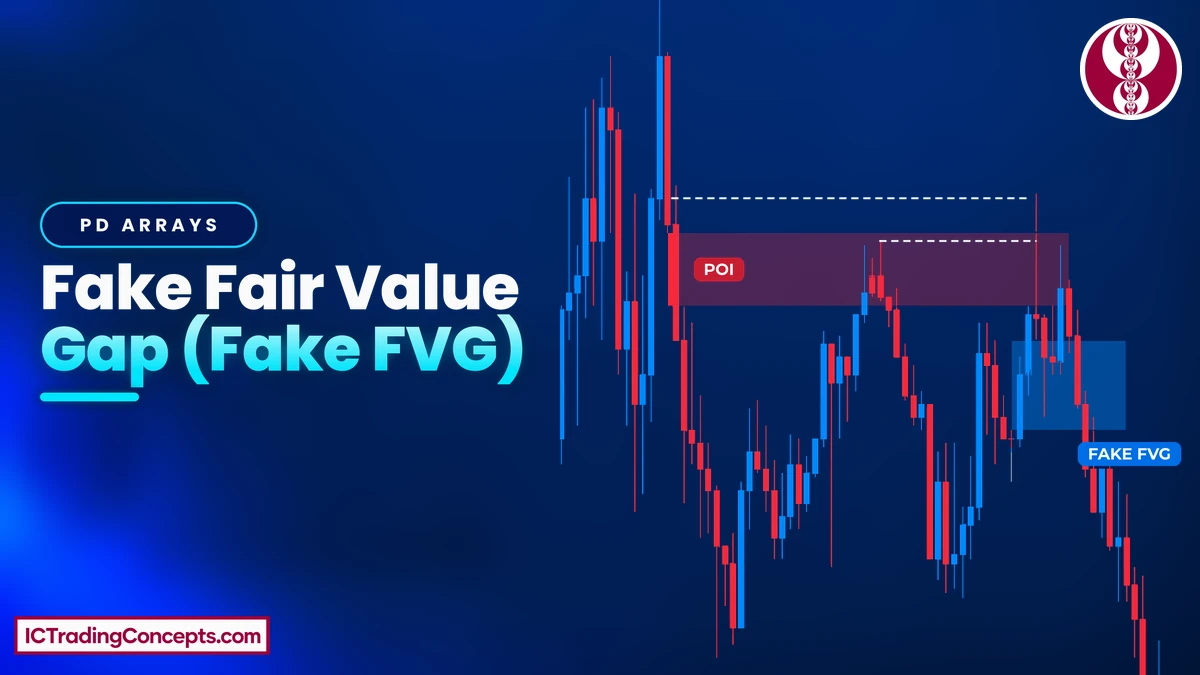
A fair value gap is a three-candle pattern where the middle candle moves so strongly that the wicks of candle 1 and candle 3 do not overlap. The space between those two wicks is the FVG. It is a core concept in the Inner Circle Trader (ICT) method and shows one-sided price delivery: price moved through that area in one direction only.
An FVG is not the same as a classic chart gap. In a classic gap, no trading happens between two bars. In an FVG, the middle candle traded through the whole area, but so quickly that the opposite side was barely offered. Traders expect price to return to rebalance it. The midpoint of the gap is called consequent encroachment (CE).
Bullish FVG
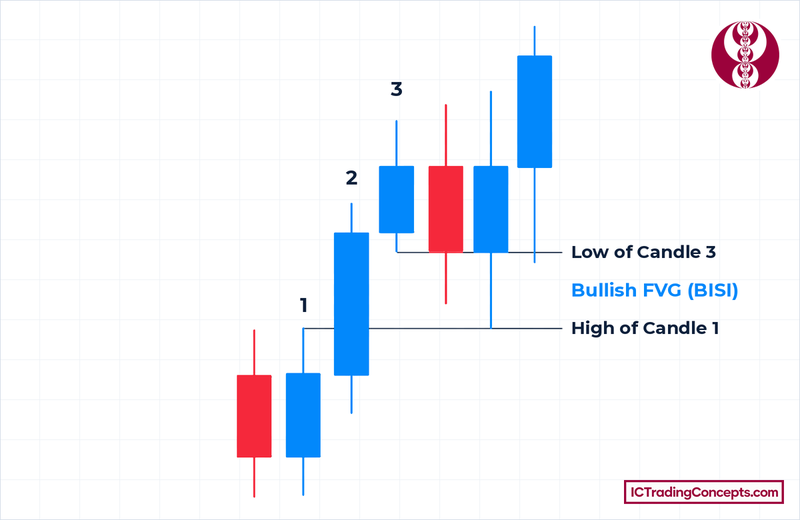
A bullish FVG forms in an upward displacement when the low of candle 3 stays above the high of candle 1. The gap runs from the high of candle 1 (bottom) to the low of candle 3 (top). ICT also calls it BISI (buy-side imbalance, sell-side inefficiency). When price returns to it from above, traders watch it as potential support.
Bearish FVG
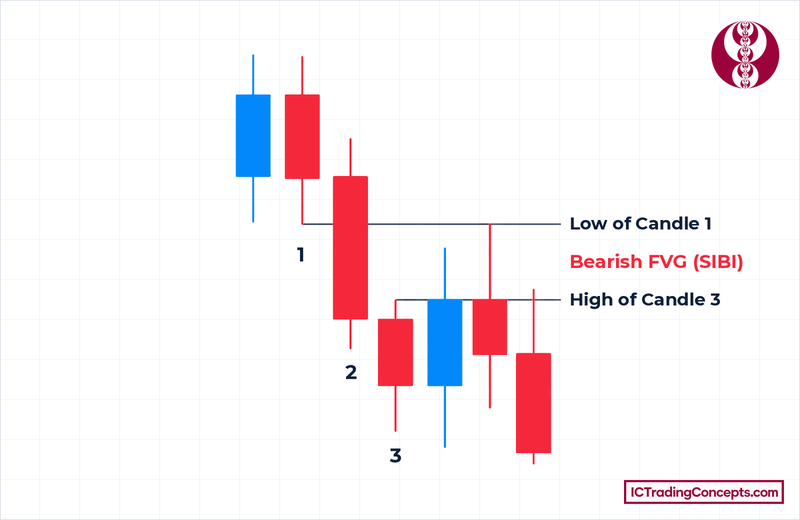
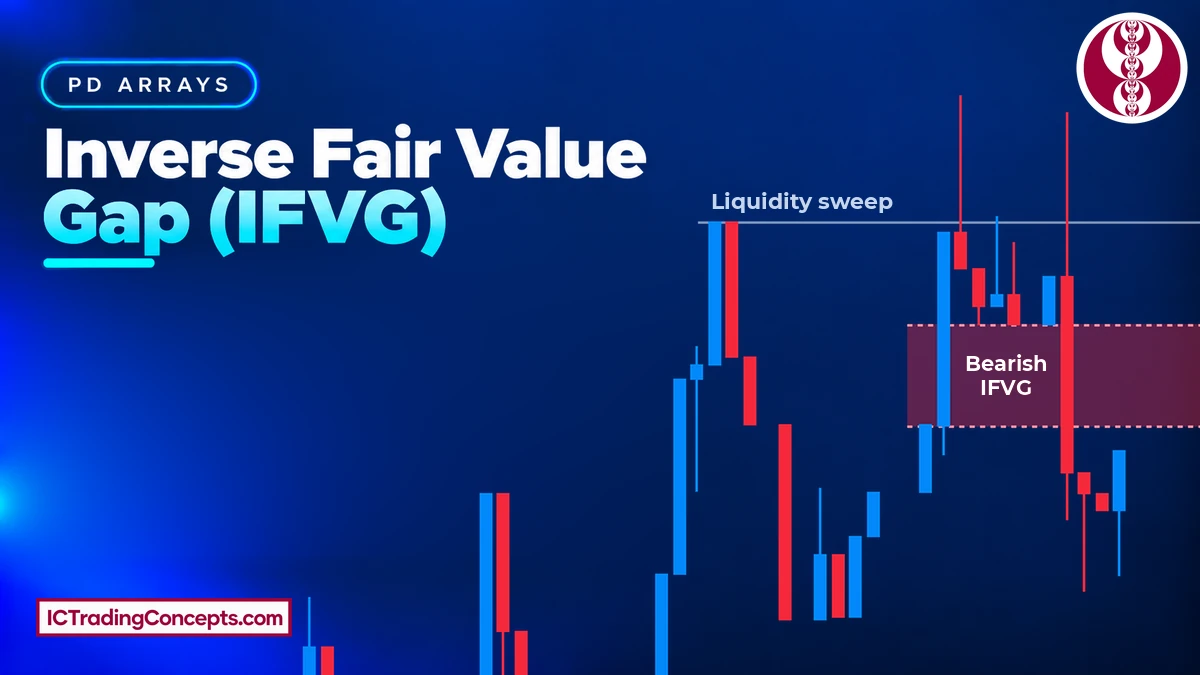
A bearish FVG forms in a downward displacement when the high of candle 3 stays below the low of candle 1. The gap runs from the high of candle 3 (bottom) to the low of candle 1 (top). ICT also calls it SIBI (sell-side imbalance, buy-side inefficiency). When price returns to it from below, traders watch it as potential resistance.
How to Identify an FVG on a Chart
Marking an FVG is mechanical, which is one reason it is popular: the boundaries come straight from two wicks, with no judgment about which candle to pick.


- Find a displacement candle: a large-bodied candle that clearly outpaces the candles around it.
- Bullish: compare the high of the candle before it with the low of the candle after it. If the later low is higher, mark the gap between them.
- Bearish: compare the low of the candle before it with the high of the candle after it. If the later high is lower, mark the gap between them.
- Draw the box from wick to wick, extend it to the right and mark the 50% line (CE).
- Check whether price has already traded back into it. An untouched gap is called unmitigated.
What Is an Order Block?
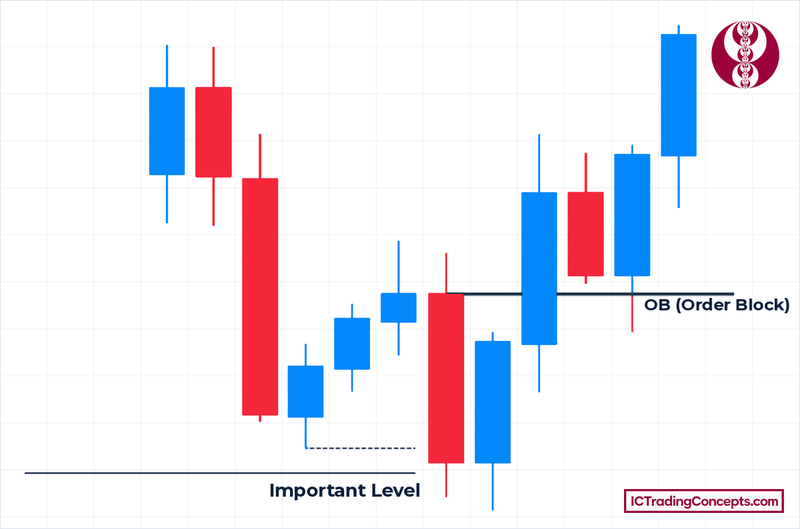
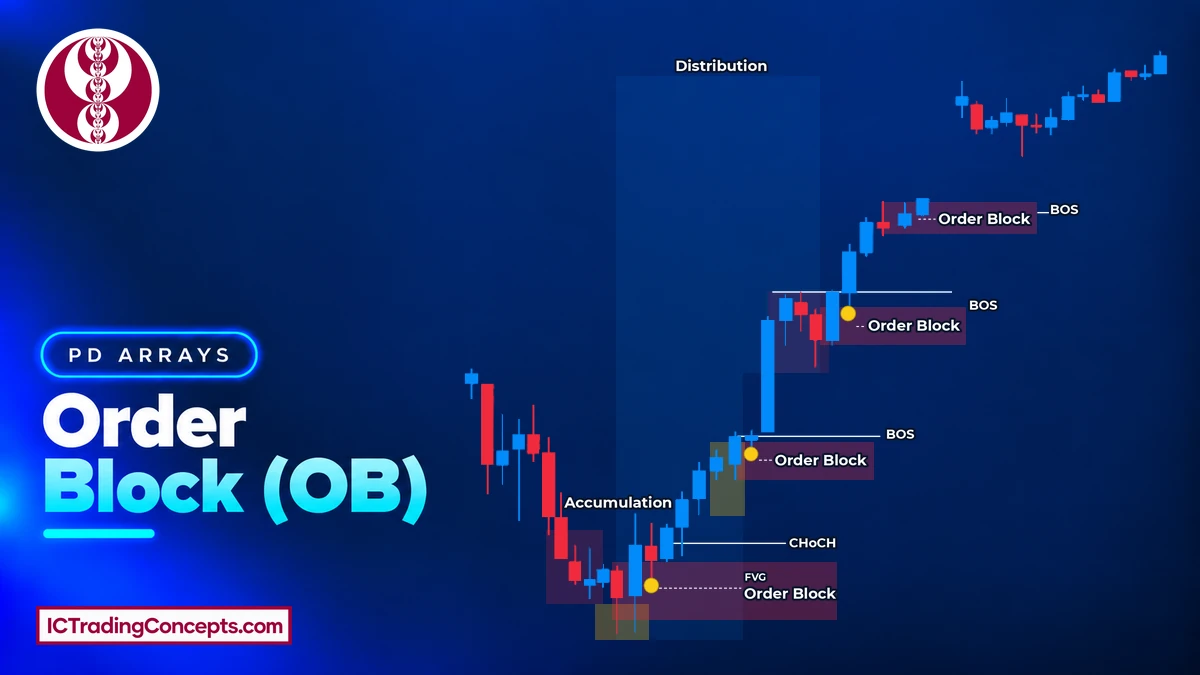
An order block is the last opposing candle, or small group of same-colored candles, before a displacement move that breaks market structure. It marks the origin of the move, where ICT teaching says large participants positioned before price expanded. The zone is usually drawn from the candle's high to its low. Its 50% level, most often measured on the candle body, is called the mean threshold.
The move away from a good order block often starts by running liquidity, meaning the stop orders resting beyond a recent high or low. That sweep is context that strengthens the block. It is not part of the definition.
Bullish Order Block
A bullish order block is the last down-close candle before an upward displacement that breaks above a recent swing high. It often forms right after price takes out a prior low. When price later returns to it from above, traders watch it as demand, meaning potential support.
Bearish Order Block
A bearish order block is the last up-close candle before a downward displacement that breaks below a recent swing low. It often forms right after price takes out a prior high. When price later returns to it from below, traders watch it as supply, meaning potential resistance.
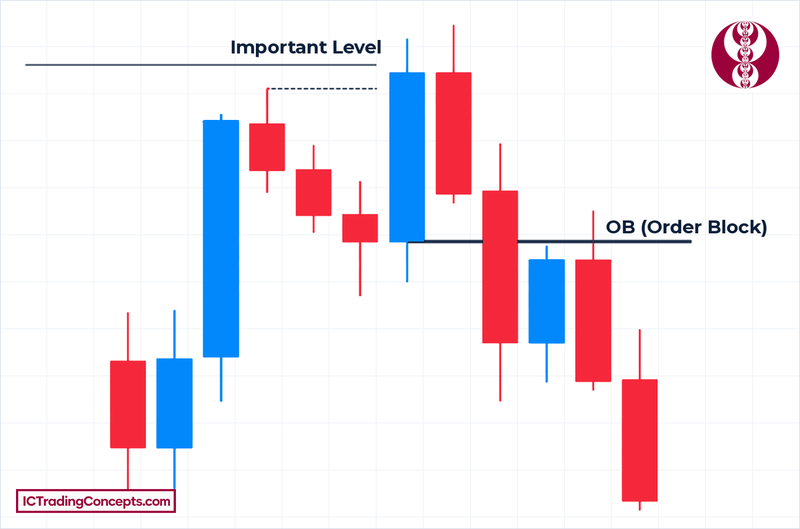
How to Identify an Order Block on a Chart
Marking an order block starts from the move, not the candle. You first need a leg that proves something changed, then you trace it back to where it began.

- Find a displacement leg that breaks structure. Bullish: a candle closes above a recent swing high. Bearish: a candle closes below a recent swing low.
- Go to the origin of that leg. Bullish: take the last down-close candle before it. Bearish: take the last up-close candle before it.
- If several opposing candles sit together at the origin, you can group them into one block.
- Draw the zone from the candle's high to its low and mark the mean threshold at 50% of the candle body. Some traders measure the full range instead; stay consistent with one method.
- Check whether price has already revisited it.
FVG vs Order Block: The Core Differences
The same displacement usually creates both zones, which is why they are easy to confuse. They mark different things. The order block shows where the move was launched. The FVG shows where the move went through too fast. That one difference drives everything else: where each zone sits, which one price reaches first, where you enter and where you are wrong.
Which Comes First: The Order Block or the FVG?
The order block always forms first, because it is the candle before the displacement. The FVG only appears once the displacement candle and the candle after it have printed. On the pullback, the order is reversed: the FVG sits closer to current price, so price reaches it first.
- Bullish: the bullish order block sits at the bottom of the up-move and the bullish FVG sits above it. A pullback from above has to trade through the FVG before it can reach the order block.
- Bearish: the bearish order block sits at the top of the down-move and the bearish FVG sits below it. A pullback from below has to trade through the FVG before it can reach the order block.
When the order block candle is also candle 1 of the FVG, the two zones touch. Price then reaches both at almost the same moment.
Bullish FVG vs Bullish Order Block
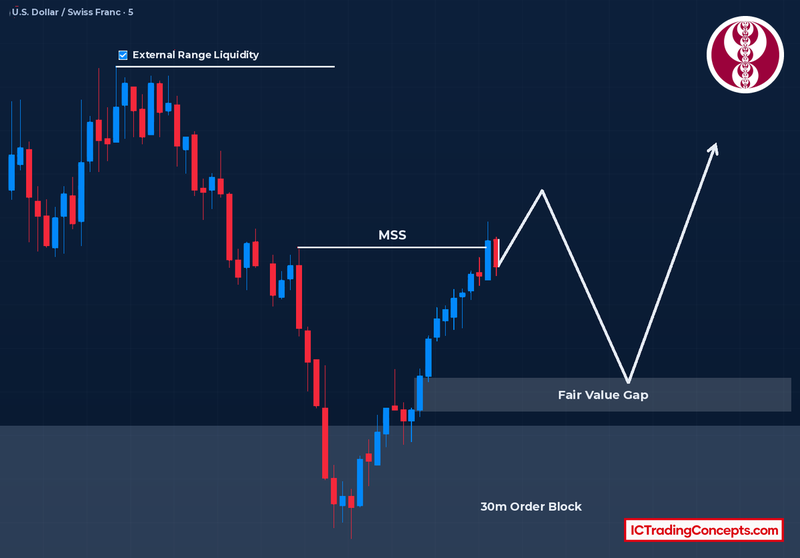
On the same bullish move, the bullish order block is the last down-close candle at the base, and the bullish FVG is the gap between the high of candle 1 and the low of candle 3 higher up in the leg. Buying the FVG means a shallower entry closer to current price. Buying the order block means waiting for a deeper pullback at a better price.
Bearish FVG vs Bearish Order Block
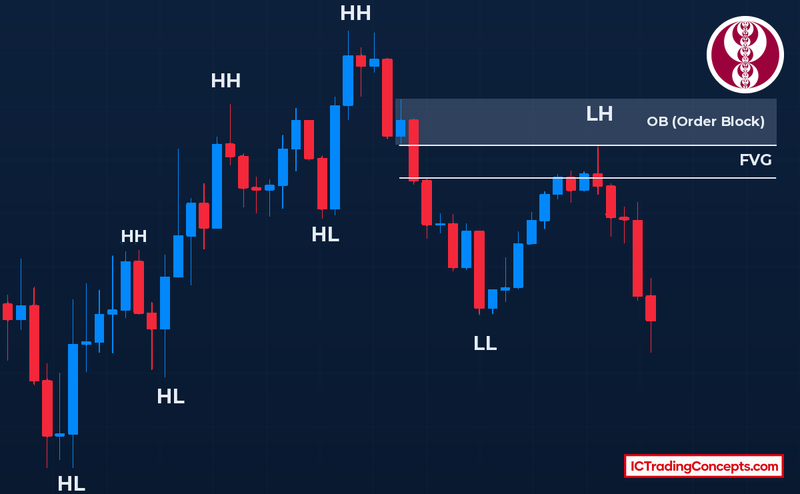
On the same bearish move, the bearish order block is the last up-close candle at the top, and the bearish FVG is the gap between the low of candle 1 and the high of candle 3 lower down in the leg. Selling the FVG means a shallower entry closer to current price. Selling the order block means waiting for a deeper rally at a better price.
Entry Levels: Consequent Encroachment vs Mean Threshold
Both zones have two common entry points: the near edge, where price first touches, and the 50% level, which ICT gives a separate name for each zone.
- Bullish FVG: the near edge is the top of the gap (the low of candle 3). CE is its midpoint.
- Bearish FVG: the near edge is the bottom of the gap (the high of candle 3). CE is its midpoint.
- Bullish order block: the near edge is the open of the down-close candle. The mean threshold is the 50% level of its body.
- Bearish order block: the near edge is the open of the up-close candle. The mean threshold is the 50% level of its body.
Many ICT traders treat a candle body closing beyond the 50% level as a sign the zone is failing. For bullish zones that means a close below CE or the mean threshold. For bearish zones it means a close above them.
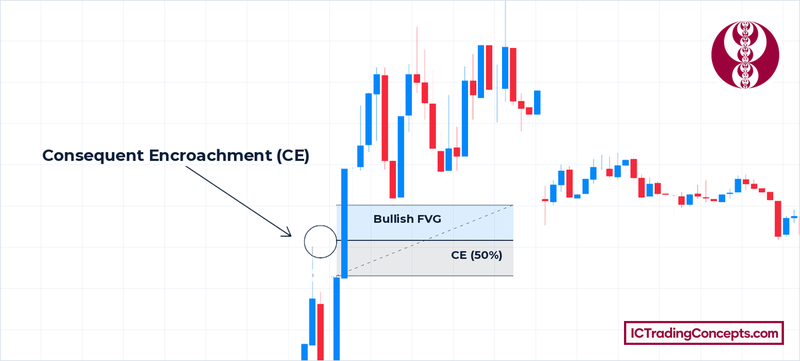
In the bullish example, the displacement candle leaves an FVG, and the line halfway between the high of candle 1 and the low of candle 3 is its CE. A buyer who wants a deeper entry than the top of the gap waits for price to reach that line. On an order block, the mean threshold works the same way, but it is measured on the body of the down-close candle instead of the gap.

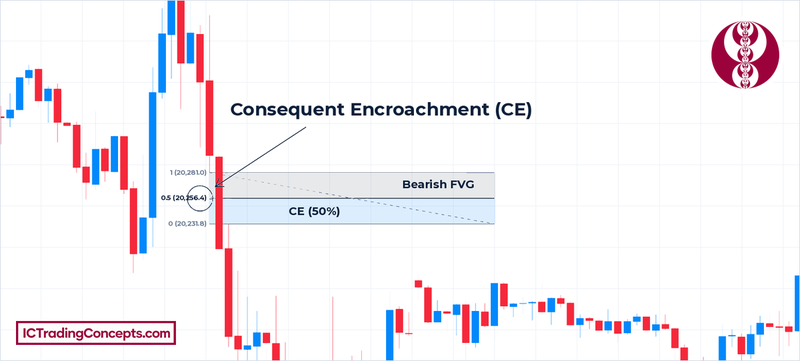
The bearish example mirrors it: the CE sits halfway between the low of candle 1 and the high of candle 3, and a seller waits for price to rally into that level. For a bearish order block, the mean threshold is the 50% level of the up-close candle's body.
Stop Placement, Invalidation and Risk-Reward
The two zones sit at different depths, so the same trade idea can carry very different risk depending on which one you use.
- FVG stop: a tight stop goes just beyond the far edge of the gap (bullish: below the high of candle 1; bearish: above the low of candle 1). A structural stop goes beyond the order block or the swing (bullish: below the low; bearish: above the high).
- Order block stop: beyond the block's extreme with a small buffer for a wick (bullish: below the order block low; bearish: above the order block high).
- FVG invalidation: a body close beyond CE is the first warning, and a full body close through the gap confirms it (bullish: close below; bearish: close above). The failed gap can then flip into an inversion FVG.
- Order block invalidation: a body close beyond the mean threshold is the first warning, and a close beyond the block's extreme confirms it (bullish: below the low; bearish: above the high). The failed block can later act as a breaker.
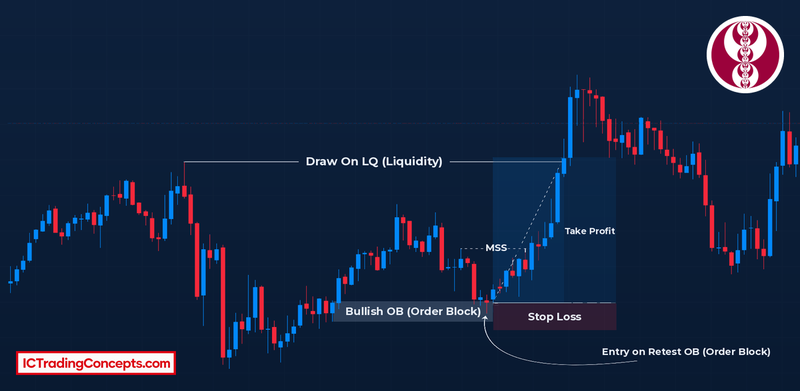
In the bullish example on gold, price pulls back into the bullish order block and the entry is taken on the retest. The stop sits below the order block low, and price then breaks the MSS high on its way to the liquidity marked above, where the target sits.
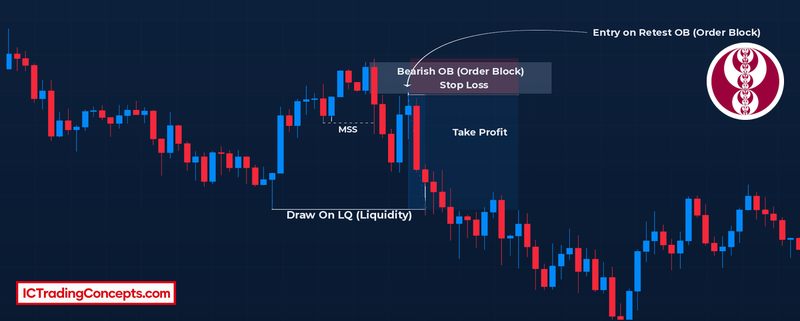
In the bearish example, price shifts structure lower and then rallies back into the bearish order block. The entry is on the retest, the stop sits above the order block high, and the target is the liquidity below. In both trades the stop is placed beyond the whole block, not just beyond the entry.
Risk-reward is where the choice often gets made. An FVG entry fills more often, but with a structural stop behind the order block the distance to your stop is larger for the same target. An order block entry gives a better price and a tighter structure, but in a strong move it may never fill. Before a bullish trade, check the distance from your entry to the buy-side liquidity above against the distance to your stop. Before a bearish trade, check the distance to the sell-side liquidity below. If the ratio does not work at the FVG, waiting for the order block is a valid plan, and missing the trade is an acceptable outcome.


FVG vs Order Block Comparison Table
This table sums up the practical differences for both directions, using the same displacement leg as the reference.
| Fair Value Gap (FVG) | Order Block (OB) | |
|---|---|---|
| What it marks | Imbalance inside the move | Origin of the move |
| Candles | Three: gap between wicks of candle 1 and 3 | One (or a small group) of opposing candles |
| Bullish version | Above the bullish order block | Last down-close candle at the base |
| Bearish version | Below the bearish order block | Last up-close candle at the top |
| Forms | Second, during displacement | First, before displacement |
| On the pullback | Reached first, fills more often | Reached later, can be missed |
| 50% level | Consequent encroachment | Mean threshold |
| Stop | Beyond the far edge, or beyond the OB | Beyond the block's extreme |
| Invalidation | Body close through the gap | Body close beyond the extreme |
| Failed version | Inversion FVG | Breaker block |
| Tends to hold in | Strong trends, shallow pullbacks | Reversals and ranges, deeper pullbacks |
How FVGs and Order Blocks Work Together
Because one displacement creates both zones, many traders read them as one area: the order block is the base, and the FVG is the imbalance built on top of it. A bullish order block followed by a bullish FVG is a demand area with two layers. A bearish order block followed by a bearish FVG is a supply area with two layers.
Stacked vs Separated Zones
Zones are stacked when the order block candle is also candle 1 of the FVG. The gap then starts right at the edge of the block, so the two zones touch and read as one area with two different reasons to hold: positioning and imbalance. Zones are separated when the displacement starts slowly and the FVG forms further along the leg, leaving space between them.


- Bullish stacked: the bullish order block sits directly under the bullish FVG. Traders often enter inside the combined zone and place the stop below the order block low.
- Bearish stacked: the bearish order block sits directly above the bearish FVG. Traders often enter inside the combined zone and place the stop above the order block high.
The practical value of stacking is that one stop covers both reasons to hold. It is added confluence, not a guarantee. The two comparison charts above show both cases: the bearish one is stacked, because the up-close candle is also candle 1 of the gap, and the bullish one is separated, because the FVG forms higher up in the leg, above the 30-minute order block. When the zones are separated, you have a decision to make, which the section on disagreement covers.
Higher-Timeframe Order Block, Lower-Timeframe FVG Entry
A common way to combine the two is to let the higher timeframe order block define the area and a lower timeframe FVG time the entry. Pairings such as a 4-hour or 1-hour order block with 15-minute or 5-minute entries, or a 30-minute order block with 5-minute entries, are preferences, not rules. On very low timeframes FVGs appear constantly, so they are more useful inside a higher timeframe zone than on their own.
The sequence is the same in both directions, only mirrored:
| Step | Bullish | Bearish |
|---|---|---|
| 1. Higher timeframe order block | Forms after a sell-side sweep and a bullish break of structure | Forms after a buy-side sweep and a bearish break of structure |
| 2. Return to the zone | Price pulls back into the bullish order block | Price rallies back into the bearish order block |
| 3. Lower timeframe shift | Price breaks and closes above a recent swing high (bullish MSS) | Price breaks and closes below a recent swing low (bearish MSS) |
| 4. Entry | At the CE of the bullish FVG inside the shift leg | At the CE of the bearish FVG inside the shift leg |
| 5. Stop | Below the shift's swing low or the order block low | Above the shift's swing high or the order block high |
| 6. Target | Higher timeframe buy-side liquidity | Higher timeframe sell-side liquidity |
When the Two Zones Disagree
When the FVG and the order block are separated, price can react at one and ignore the other. There is no fixed rule for which one wins, but market context shifts the odds, and the lower timeframe shows you the answer in real time.
Strong Trends: Price Often Holds at the FVG
In a strong trend, pullbacks are often shallow. Price taps the FVG, holds and continues, and the order block further back is never tested.
- Bullish: in a strong uptrend, price dips into a bullish FVG, holds around its CE and continues higher. The bullish order block below stays untouched.
- Bearish: in a strong downtrend, price rallies into a bearish FVG, rejects and continues lower. The bearish order block above never trades.
Waiting for the order block in these conditions often means watching the move leave without you. That is why continuation traders lean on FVGs, and why a deep order block entry in a strong trend usually needs extra confirmation.
Reversals and Ranges: Deeper Pullbacks Reach the Order Block
At a reversal the first pullback is often deeper, because the market is changing direction rather than continuing one. Price can run straight through the FVG, sometimes closing through it, and then hold at the order block.
- Bullish: after a sell-side sweep and a bullish shift, price pulls back through the bullish FVG and finds support at the bullish order block.
- Bearish: after a buy-side sweep and a bearish shift, price rallies back through the bearish FVG and finds resistance at the bearish order block.
In ranges, FVGs form and fill in both directions, so they overlap and lose clarity. Order blocks at the edges of the range tend to give cleaner reference points.
When you cannot tell which zone will hold, let the lower timeframe decide. Bullish: at the FVG, wait for a bullish structure shift on the lower timeframe; if it does not come and price keeps falling, wait for the order block and look for the same shift there. Bearish: at the FVG, wait for a bearish structure shift; if price keeps rising instead, wait for the order block and look again.
What Makes a Zone Worth Acting On?
The definition tells you whether a zone exists. Context tells you whether it deserves a trade. The same checks apply to both zones in both directions, with a few differences.
Conditions That Strengthen an FVG
A gap gains weight when the move that created it clearly meant something.
- Clear displacement: a large middle candle, not a small gap in slow price action.
- Part of the structure break: bullish, the gap sits in the leg that broke a swing high; bearish, in the leg that broke a swing low.
- First return: an untouched gap tends to react better than one price has already traded into.
- Higher timeframe alignment: bullish gaps in a higher timeframe uptrend, bearish gaps in a higher timeframe downtrend.
- Created after a sweep: bullish, after price took a prior low; bearish, after price took a prior high.
Conditions That Strengthen an Order Block
An order block gains weight when it shows both positioning and intent.
- Liquidity taken first: a bullish block that swept a prior low, or a bearish block that swept a prior high.
- Displacement that leaves an FVG: many ICT traders treat this as confirmation, and a block without it is usually weaker.
- Break of structure: bullish, the move closes above a swing high; bearish, below a swing low.
- Unmitigated: price has not yet returned to the block.
- Clear and obvious: a well-defined candle at the true origin, not an ambiguous one in the middle of noise.
Premium vs Discount Location
Location is often the quickest filter. Take the dealing range from swing low to swing high and find the 50% level, called equilibrium; a Fibonacci retracement tool does this directly. Below 50% is discount, above 50% is premium.
- Bullish: prefer zones in discount. If the bullish FVG sits in premium and the bullish order block sits in discount, the order block is the better-located zone.
- Bearish: prefer zones in premium. If the bearish FVG sits in discount and the bearish order block sits in premium, the order block is the better-located zone.
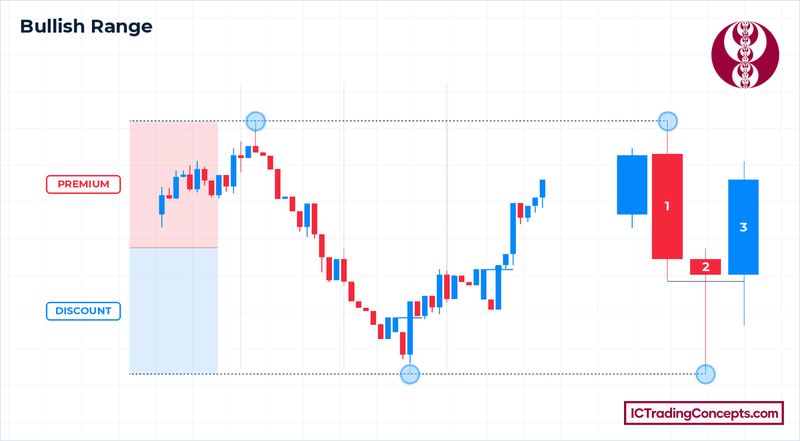
In the bullish range, the box runs from the swing high down to the new swing low, so the upper half is premium and the lower half is discount. Price turns up from the discount half, which is where a bullish FVG or order block is better located. The small three-candle drawing on the right shows how the range is anchored on candle highs and lows.
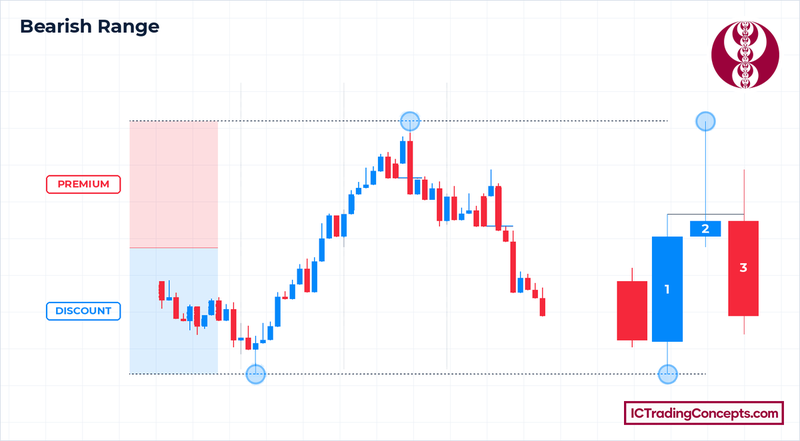
The bearish range mirrors it: the box runs from the swing low up to the new swing high, and price turns down from the premium half. For a short, a bearish FVG or order block in that upper half is the better-located zone.
In very strong trends, pullbacks may never reach discount (bullish) or premium (bearish). A trade from a poorly located FVG is still possible there, but it is a lower-quality setup and deserves smaller risk or stronger confirmation.
Real Market Example
The two trades below show the model in both directions: one zone gives the area, and a gap or a structure shift decides the entry.
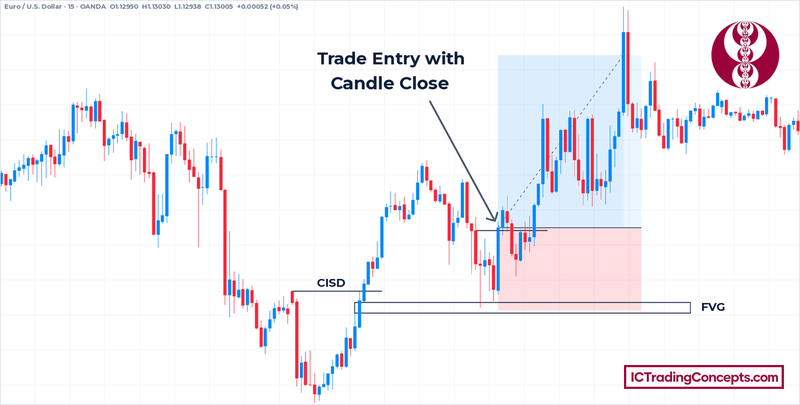
Bullish example (EUR/USD, 15-minute). On the 4-hour chart, a single order block candle had formed inside a bullish FVG zone and price moved up from it, which gave the higher timeframe area. On the 15-minute chart, price then closed above the CISD level, a change in state of delivery to the upside, and the move left a bullish FVG. The pullback wicked into the top of that gap and held. The entry triggered when a candle closed above the open of the down-close candle that started the pullback, in other words above that small bullish order block. The stop sat near the bottom of the FVG, the target was set at about twice the risk, and price reached it.
Bearish example (gold, 1-minute). Here the bullish idea failed first. After a bullish market structure shift (MSS), price left an FVG (circled), but a candle then closed below the previous bullish order block and formed a new, bearish MSS. The last up-close candle before that drop, marked OB, became the bearish order block. Price pulled back into it, and a short from the block, with the stop above the block and a target about 2.7 times the risk, reached the target.
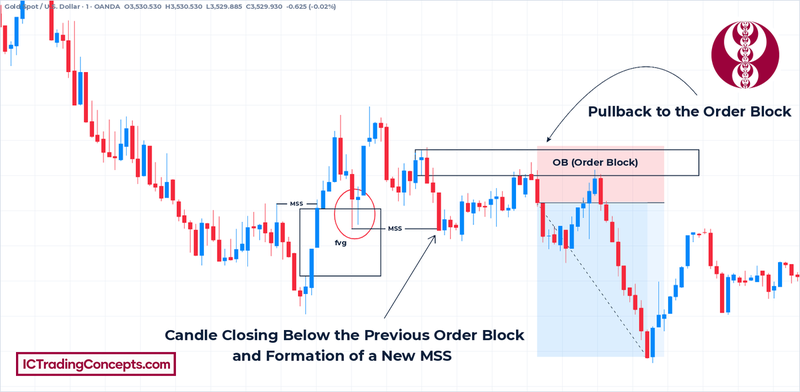
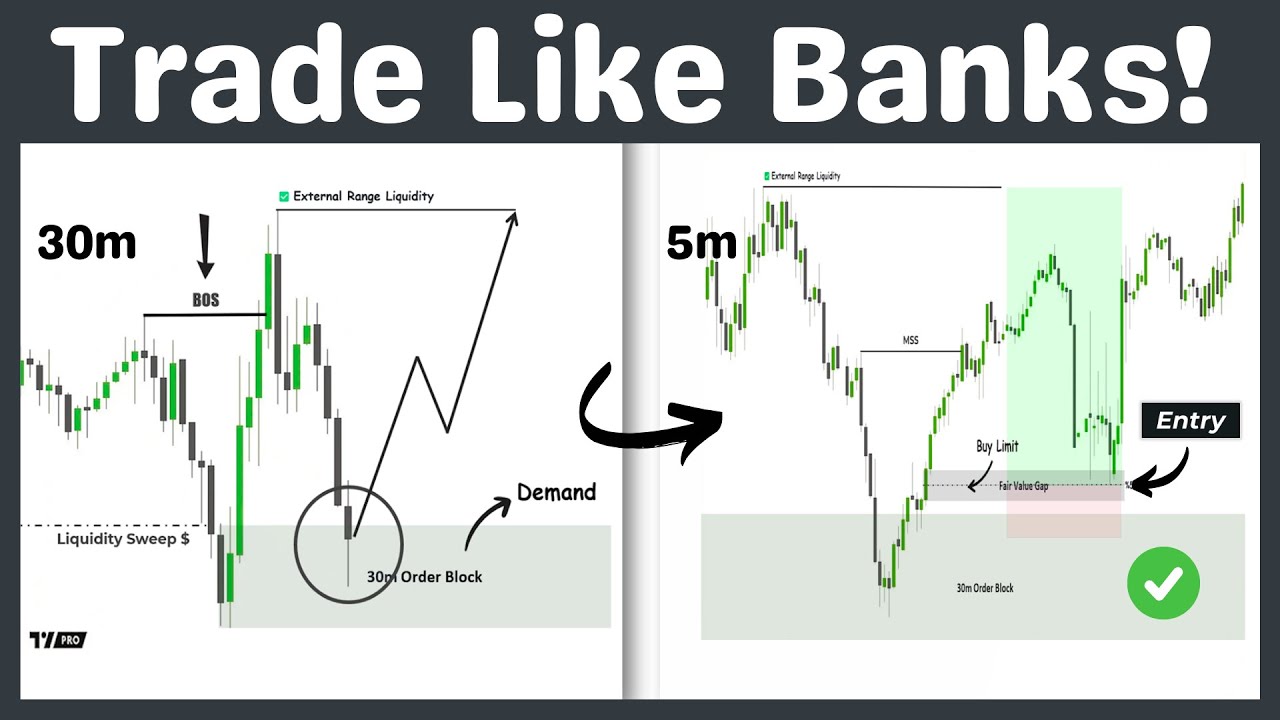
In both trades the order block defines where to act, and the FVG or the structure shift decides when. The bearish case also shows the invalidation rule from the stop placement section: once a candle closes through a zone, that zone is no longer valid, and the opposite setup can take over. The video below walks through two more trades that use a 30-minute order block with a 5-minute FVG entry, starting at 6:50. These are selected examples that show the process, not evidence of an edge.
Common Mistakes to Avoid
Most errors with these two zones come from marking too many of them or using them without context.
- Marking every small gap or opposing candle. Without clear displacement, a tiny FVG or an ordinary candle is not a meaningful zone.
- Trading against the higher timeframe. Buying a bullish FVG in a higher timeframe downtrend, or selling a bearish order block in a higher timeframe uptrend, fights the bigger flow.
- Forcing confluence. Calling two zones "stacked" when there is clear space between them hides the real decision you need to make.
- Ignoring location. Bullish zones in premium and bearish zones in discount are weaker even when they look clean.
- Using one zone in every context. Waiting for the order block in a strong trend often misses the move; buying or selling the FVG at a reversal often gets stopped as price runs to the order block.
- Having no invalidation rule. Holding a bullish idea after a body close below the order block low, or a bearish idea after a body close above the order block high, turns a planned loss into a larger one.
Indicators That Mark Both Zones
Indicators can speed up marking, but they do not judge context, location or quality. Use them to find zones, then apply the filters above yourself.
- ICT Concept [TradingFinder] Order Block | FVG | Liquidity Sweeps: marks order blocks, FVGs and liquidity levels together, which helps you check whether liquidity was taken before a block formed.
- FVG Order Blocks [BigBeluga]: pairs each FVG with the order block behind it, plotting the block below bullish gaps and above bearish gaps.
- Smart Money Concepts (SMC) [LuxAlgo]: shows BOS and CHoCH, order blocks, FVGs and premium and discount zones on one chart.
Test Your FVG vs Order Block Knowledge
Eight quick questions on which zone forms first, which one price reaches first, their 50% levels, stacking and which one tends to hold. Each answer links back to the section that explains it.
ABCD Answer with your keyboard
-
01Which zone forms first in a displacement move?
The order block is the last opposing candle before the displacement, so it always forms first. The FVG only appears once the displacement candle and the candle after it have printed. Review: this section
-
02In a bullish setup, which zone does a pullback from above reach first?
In a bullish move the FVG sits above the bullish order block, closer to current price, so a pullback has to trade through the FVG before it can reach the order block. Price reaches both together only when they are stacked. Review: this section
-
03What is the 50% level of an order block called?
The 50% level of an order block, usually measured on the candle body, is the mean threshold. Consequent encroachment is the 50% level of an FVG, and equilibrium is the 50% level of the whole dealing range. Review: this section
-
04When are an FVG and an order block stacked?
If the order block candle is also candle 1 of the FVG, the gap starts right at the edge of the block and the two read as one area with two reasons to hold. Space between them means they are separated. Review: this section
-
05In a strong trend with shallow pullbacks, which zone often holds?
In a strong trend price often taps the FVG, holds and continues, and the order block further back is never tested. Deeper pullbacks that reach the order block are more common at reversals and in ranges. Review: this section
-
06What can a failed order block and a failed FVG become?
A failed order block can later act as a breaker block, and a gap that price closes through can flip into an inversion FVG. Option B swaps the two. Review: this section
-
07For a bullish trade, which zones are better located?
Prefer bullish zones in discount, the lower half of the dealing range, and bearish zones in premium, the upper half. A bullish FVG in premium is weaker than a bullish order block in discount. Review: this section
-
08In the higher-timeframe order block, lower-timeframe FVG entry model, what must happen on the lower timeframe before the entry?
After price returns to the higher-timeframe order block, the lower timeframe must break and close beyond a recent swing in the trade's direction. The entry is then at the CE of the FVG inside that shift leg. Review: this section
Review your answers
Conclusion
An order block and an FVG are two footprints of the same move. The order block is the origin and forms first; the FVG is the imbalance and gets reached first. Bullish FVGs sit above bullish order blocks, and bearish FVGs sit below bearish order blocks. Choose between them with location, trend context, quality and risk-reward, and when they are stacked, treat them as one zone. When they disagree, the lower timeframe structure shift shows which one price is actually respecting.
Sources
- Gap (chart pattern): Wikipedia
- Understanding order types, investor bulletin: Investor.gov (SEC)
- Order blocks or fair value gaps: Trader Mayne, YouTube
- How I combine liquidity sweeps, FVGs and order blocks: Smart Risk, YouTube
Be the first to share your thoughts on this article.