

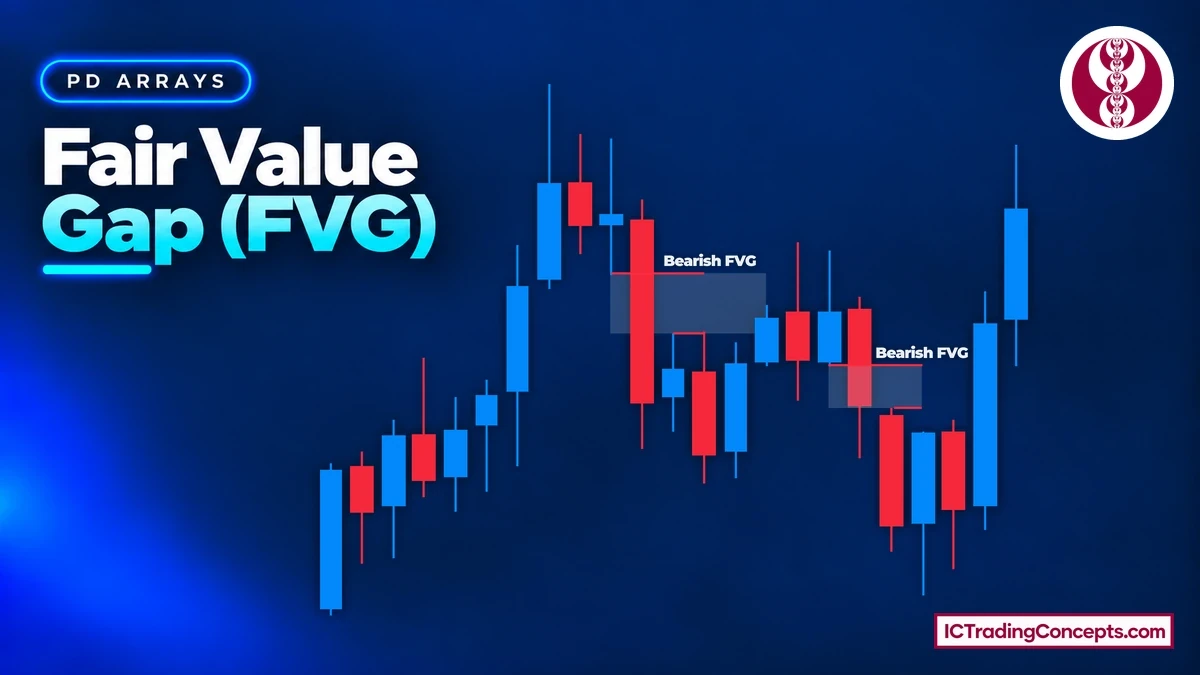
A Fair Value Gap (FVG) is a three-candle price pattern where a large middle candle moves price so fast that the wicks of the first and third candles do not overlap. The empty space between those two wicks is the gap. In a bullish FVG it sits between the high of candle 1 and the low of candle 3. In a bearish FVG it sits between the low of candle 1 and the high of candle 3. Traders mark this zone because price often comes back to it, although it does not always do so.
Key Takeaways
- A Fair Value Gap needs three candles and a gap between the wick of candle 1 and the wick of candle 3.
- A bullish FVG (BISI) forms on a strong up move. A bearish FVG (SIBI) forms on a strong down move.
- Mark the zone from wick to wick, not from body to body. Its 50% level is called Consequent Encroachment (CE).
- Price often retraces into an FVG, but some gaps are never revisited.
- A candle body closing beyond the far edge of the gap invalidates it. A wick passing through does not.
What Is a Fair Value Gap in Trading?
A Fair Value Gap is an area on the chart where price moved in one direction with almost no trading on the other side. The concept was popularized by Michael J. Huddleston, known as the Inner Circle Trader (ICT), and it is one of the core price delivery tools in ICT and Smart Money Concepts (SMC).
The pattern always uses three consecutive candles. Candle 2 is the large, fast candle. Candles 1 and 3 sit on either side of it. If the wick of candle 1 and the wick of candle 3 do not touch, the part of candle 2 that neither wick covers is the gap. That zone is also called an imbalance, because one side of the market was in control and the other side had little chance to trade there.
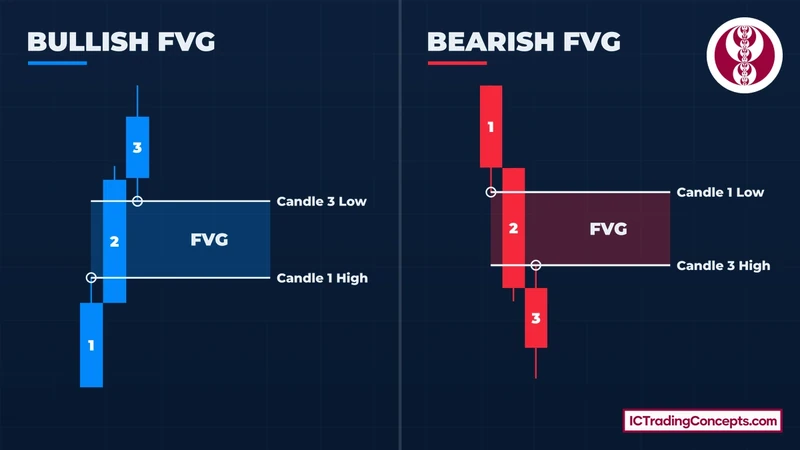
The FVG is a zone, not a single line. It has an upper edge, a lower edge and a midpoint, and each of these levels can matter when price comes back.
How Does a Fair Value Gap Form?
An FVG forms when large orders push price quickly through a range of levels. The move is one strong candle, sometimes called displacement, and it leaves part of its range unfilled by the candles around it.
Whether a gap actually exists depends on the wicks of candles 1 and 3, as the marking steps below show.
Bullish Fair Value Gap (BISI)
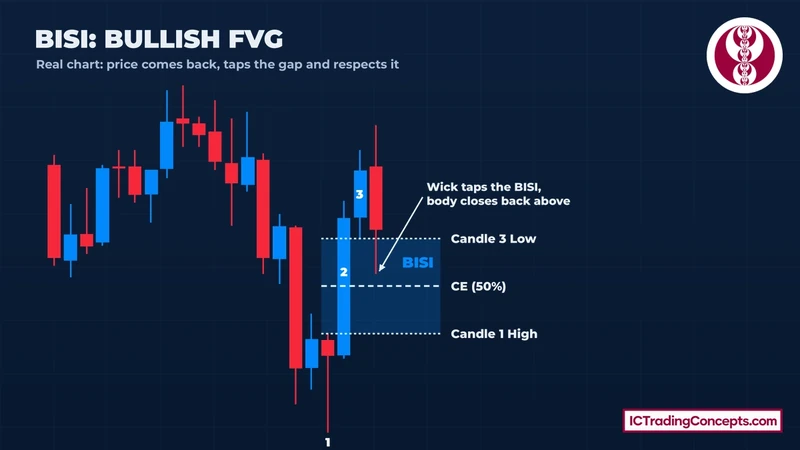
A bullish FVG forms during a strong up move. The gap runs from the high of candle 1 up to the low of candle 3. In ICT terms it is called BISI, short for Buyside Imbalance Sellside Inefficiency: buyers were in control and sell orders were barely filled in that range.


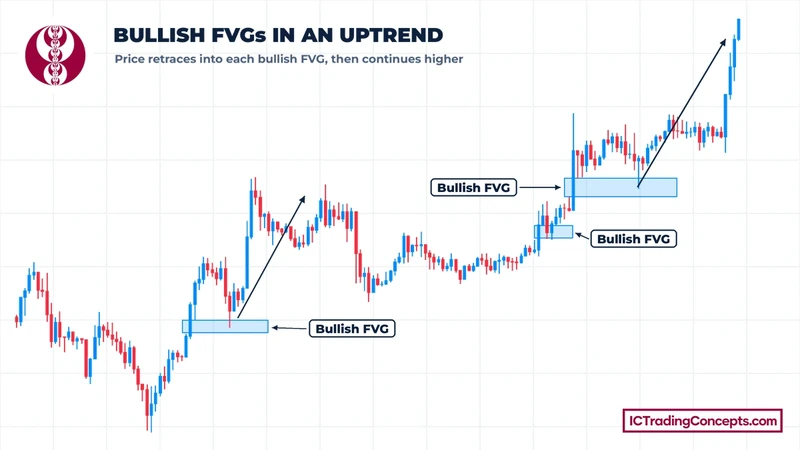
When price later trades back down into a bullish FVG, the zone can act as support, as in the fair value gap example below.
Bearish Fair Value Gap (SIBI)
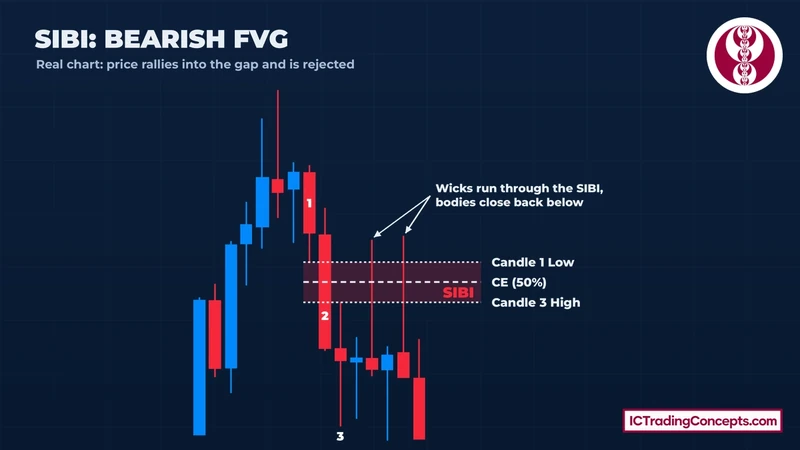
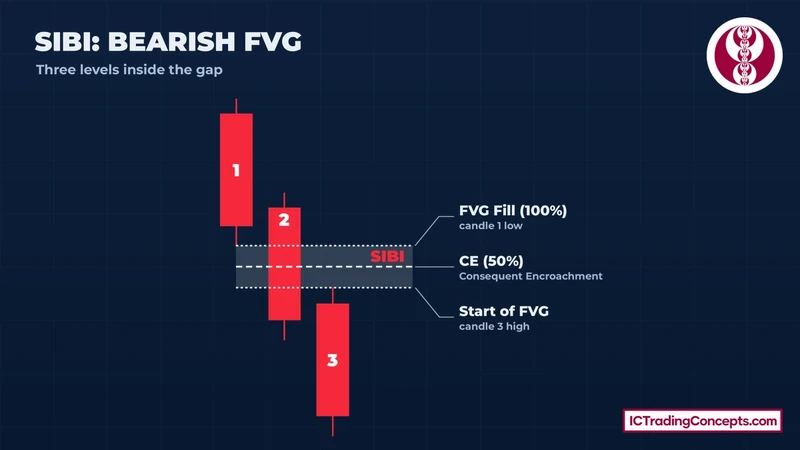
A bearish FVG forms during a strong down move. The gap runs from the low of candle 1 down to the high of candle 3. ICT calls it SIBI, short for Sellside Imbalance Buyside Inefficiency: sellers were in control and buy orders were barely filled in that range.
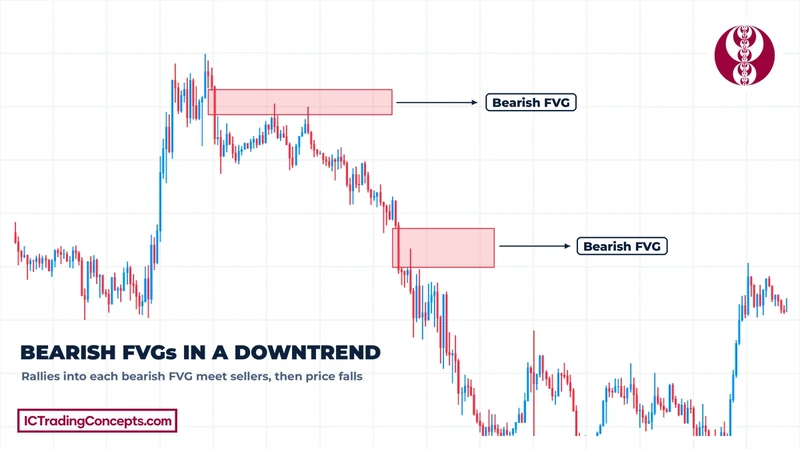
When price later trades back up into a bearish FVG, the zone can act as resistance.
How to Mark a Fair Value Gap Correctly
Most marking errors come from using the wrong part of the candle. An FVG is measured with wicks, because the wicks show the full range each candle traded.
Follow these steps on any timeframe:
- Find a large candle (candle 2) that moved price strongly.
- Look at the candle before it (candle 1) and the candle after it (candle 3).
- For a bullish FVG, draw a line at the high of candle 1 and another at the low of candle 3.
- For a bearish FVG, draw a line at the low of candle 1 and another at the high of candle 3.
- If the lines leave a space between them, shade it. That box is the FVG.
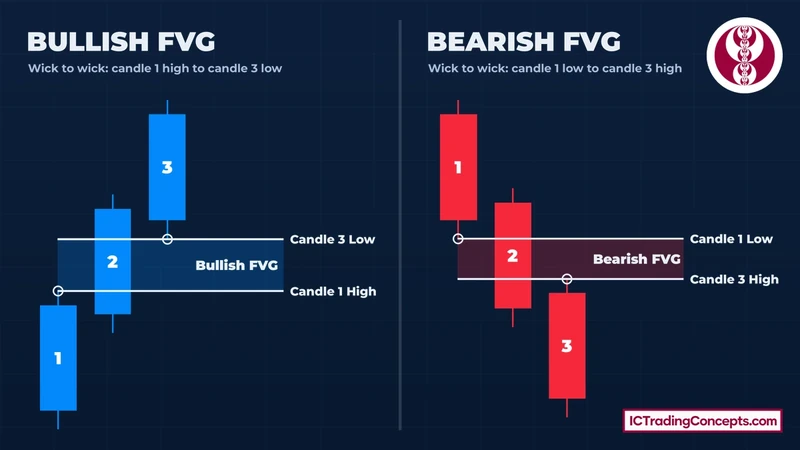
In both versions the box sits inside candle 2's range.
If the wicks of candle 1 and candle 3 overlap, even by a small amount, the three candles do not form an FVG. A big middle candle alone is not enough.
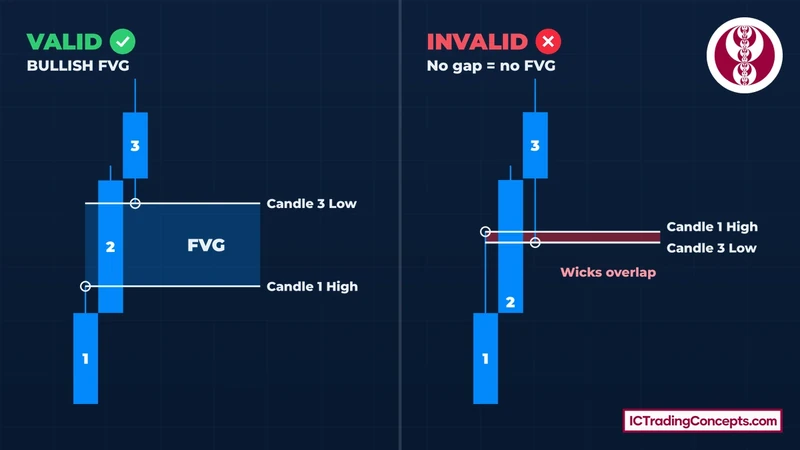
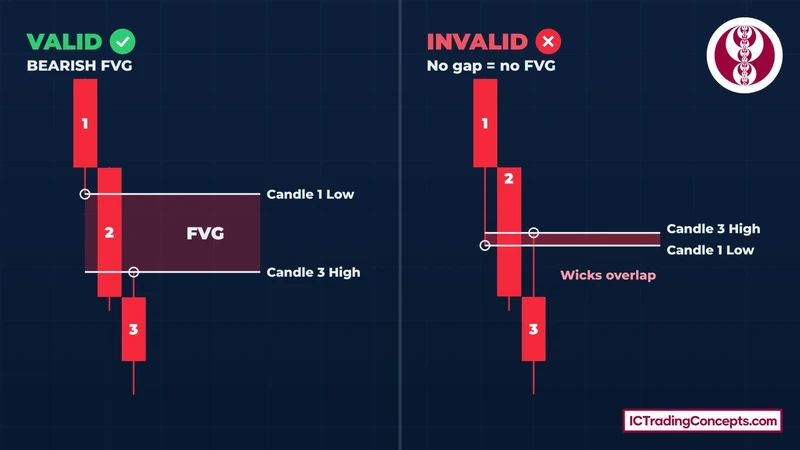
The bearish check works the same way: candle 3's high must stay below candle 1's low. Once candle 3's wick reaches candle 1's wick, the gap is closed before it ever forms.
The 50% Level of an FVG (Consequent Encroachment)
The midpoint of an FVG is called Consequent Encroachment (CE). To find it, measure halfway between the two edges of the gap. Many traders draw it as a thin line inside the box. The far edge of the box is the point where the gap counts as fully filled.
CE is useful because it shows how deep price has traded into the gap. In a bullish gap, candle bodies that hold above CE suggest the zone is still being respected. In a bearish gap, bodies that hold below CE suggest the same. A body close through CE does not invalidate the gap on its own, but it shows the zone is being tested more deeply.


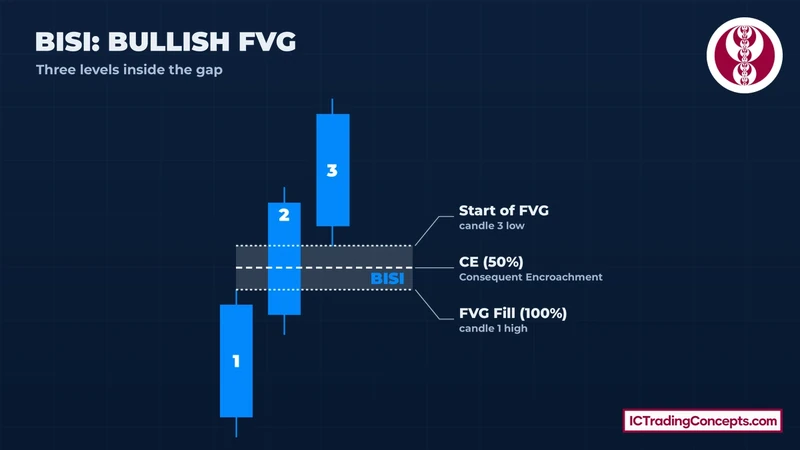
The same 50% line is drawn inside a SIBI, where price retraces up into the box.
Why Does Price Return to an FVG?
When price moves through a range too quickly, part of that range is left with orders from only one side. In ICT terms, the market delivered price inefficiently. Price often trades back into that range later to rebalance it before continuing.
This is why the gap is treated as a reaction zone. A bullish gap below current price is a place where buyers may step in again. A bearish gap above current price is a place where sellers may step in again. The return is a tendency, not a rule.
In a downtrend the picture is reversed. Price rallies back into bearish FVGs above it, reacts lower, and continues toward the next low.
Does Price Always Fill a Fair Value Gap?
No. Many FVGs are revisited, but some are not. When a move is very strong, price can leave a gap behind and never return to it. ICT calls a gap like this a breakaway gap: an FVG that price does not come back to fill, often because the trend is too strong.
A gap can also be partly filled. Price may trade into the top portion of a bullish FVG, react, and leave the rest of the zone untouched. For this reason, waiting for every gap to be "filled" before taking a view on the market is not a reliable approach.
Strong vs Weak Gaps
Every FVG meets the same definition, but not every gap carries the same weight. The points below are context: they can make a gap more useful, but none of them is required for the gap to exist.
Signs of a stronger FVG:
- Clear displacement: candle 2 closes near its extreme.
- Candle 2 breaks out of the previous candle's range or breaks a recent swing high or low.
- Candle 3 continues in the same direction instead of stalling.
- The gap forms right after price takes out an obvious high or low (a liquidity sweep).
- The gap points the same way as the higher-timeframe bias.
Signs of a weaker FVG:
- The gap is tiny compared with recent candles.
- It forms inside a choppy, sideways range where candles keep overlapping.
A weak gap still meets the definition. It simply gives less reason to expect a reaction when price returns.
When the Gap Becomes Invalid
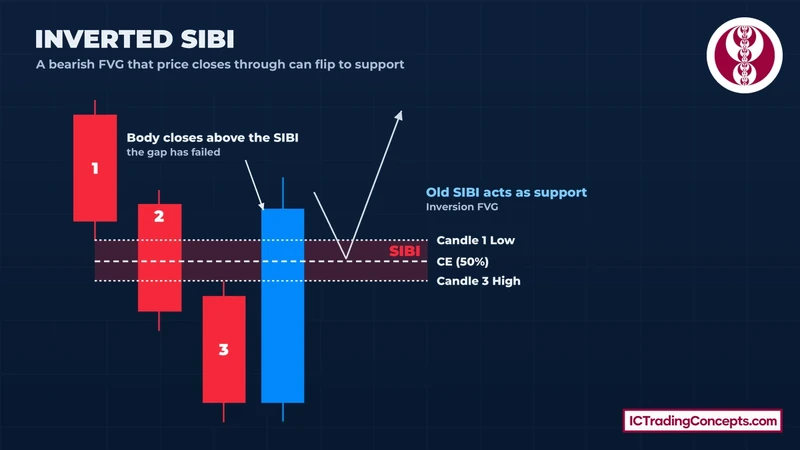
A gap is invalidated when a candle body closes beyond the far edge of the zone. For a bullish gap that means a close below its lower edge. For a bearish gap it means a close above its upper edge. A wick that pierces the zone and closes back inside it does not invalidate the gap.

After a body close through the zone, the gap often changes role. A bearish gap that price closes above can start acting as support. This flipped zone is called an Inversion Fair Value Gap (IFVG).
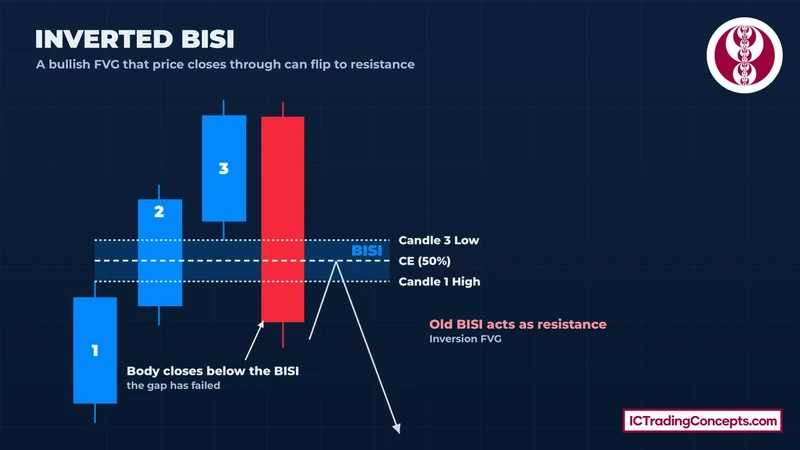
The bullish case mirrors it. A bearish candle closes fully below the BISI, the gap is no longer valid support, and price can later reject from it as resistance.
FVG Variants and Look-Alike Concepts
Several ICT terms describe gaps or zones that look similar to an FVG. They are related, but they are not the same thing. The table separates the ones traders confuse most often.
| Concept | What it is | How it differs from an FVG |
|---|---|---|
| Inversion FVG (IFVG) | A gap that price closed through with a body | Same zone, opposite role: support becomes resistance or the reverse |
| Balanced Price Range (BPR) | The overlap of a bullish gap and a bearish gap at the same price | Built from two opposite gaps, not one |
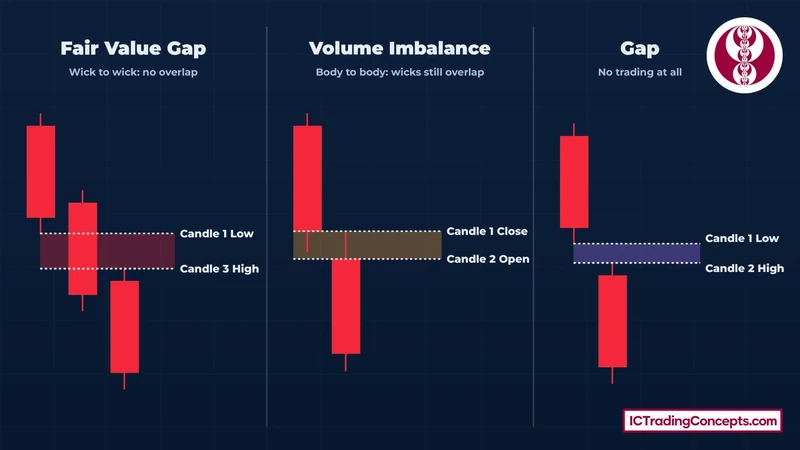
| Volume Imbalance | A gap between the bodies of two candles whose wicks still overlap | Measured body to body; an FVG needs a gap between wicks |
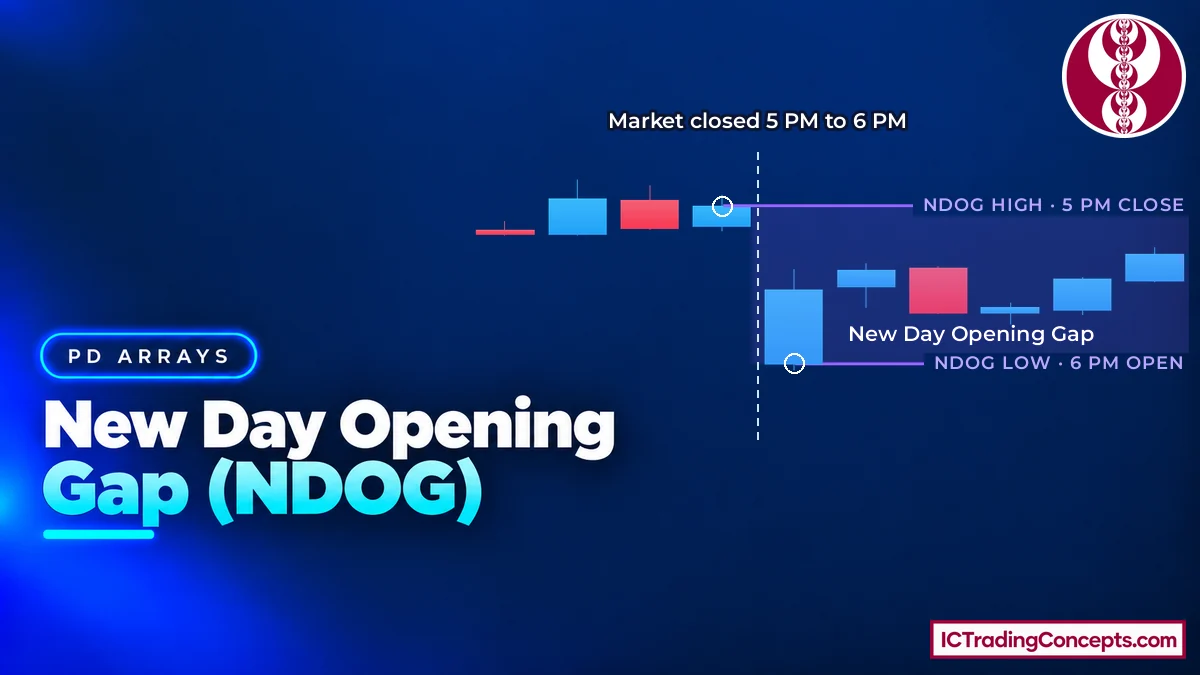
| Price gap (opening gap) | A space between two consecutive candles where even the wicks do not overlap | No trading at all inside the space; an FVG is inside one traded candle |
| Breakaway gap | An FVG that price never returns to | Describes what happens after the FVG, not a different shape |
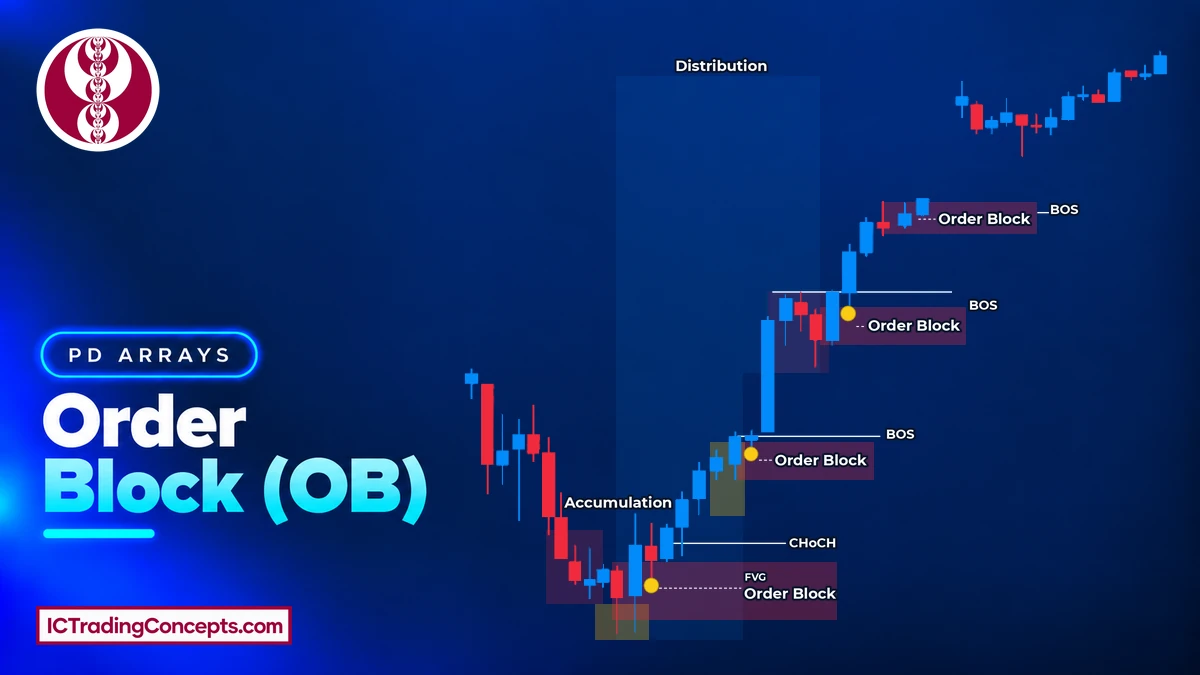
| Order block | The last opposite-colored candle before the move that created the FVG | A candle range, not a gap between wicks |
A regular price gap is the easiest to tell apart, because no price traded inside it at all. A volume imbalance is the closest look-alike, because it can appear in the same move as an FVG.
How Traders Use These Gaps in Practice
An FVG is a reference zone, not a complete trading strategy. In FVG trading, traders usually combine it with market structure, the higher-timeframe bias and liquidity.
A simple flow looks like this:
- Decide the direction from the higher timeframe.
- Mark FVGs that point the same way.
- Wait for price to retrace into one of them.
- Watch for a reaction at the edge or at CE, often confirmed on a lower timeframe.
- Plan the trade toward the next obvious high or low, with risk placed beyond the gap. A stop can be hit by a wick before the gap is invalidated by a body close.
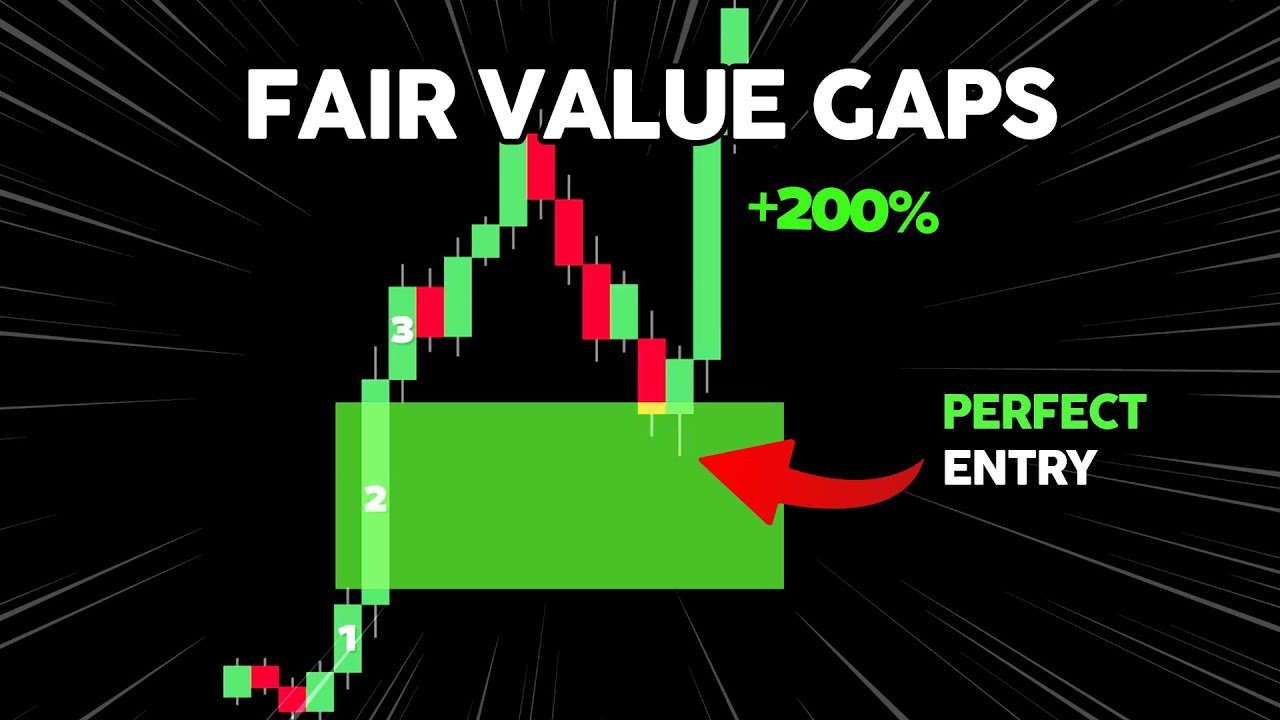
The video below walks through how FVGs form, the difference between BISI and SIBI, the levels inside a gap and a multi-timeframe example.
Using Different Timeframes
FVGs form on every timeframe, from the 1-minute chart to the monthly chart. There is no single best timeframe. Higher-timeframe gaps, such as those on the daily or 4-hour chart, form less often and act as major reference zones. Lower-timeframe gaps, such as those on the 15-minute or 5-minute chart, form often and can help time a reaction inside a larger zone.


A common approach is to mark FVGs on a higher timeframe for context and use a lower timeframe to watch how price behaves when it reaches them.
Different Markets
FVGs appear in any liquid market that is shown on a candlestick chart, including forex pairs, stocks, crypto and futures such as E-mini Nasdaq-100 futures and gold futures. The definition does not change from one market to another: an FVG in forex is marked the same way as one on Nasdaq futures.
Common Mistakes to Avoid
Most FVG problems come from marking the zone too loosely or expecting too much from it. These are the mistakes that cause the most confusion:
- Treating every FVG as tradable. Small gaps inside choppy ranges appear constantly and carry little weight.
- Marking from body to body. The gap is measured from the wick of candle 1 to the wick of candle 3.
- Calling an FVG invalid because a wick passed through it. Only a body close beyond the far edge invalidates the gap.
- Confusing an FVG with an IFVG. Once price closes through a gap, its role can flip, so the old direction no longer applies.
- Trading FVGs against the higher-timeframe bias. A gap that points against the main trend is more likely to fail.
- Expecting every gap to be filled. Some FVGs are only partly filled and some are never revisited.
FVG Indicators on TradingView
Indicators can mark FVGs automatically, which saves time when scanning several charts. They follow the same three-candle rule, so it is still worth checking each zone by eye.
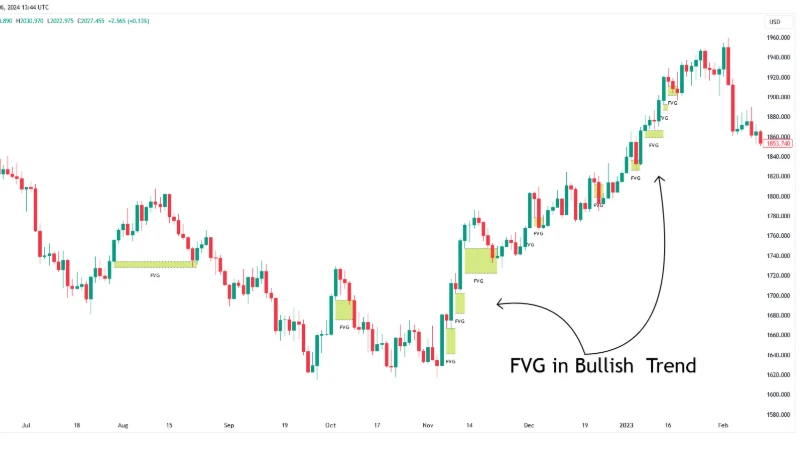
FVG Detector [TradingFinder] Fair Value Gap-Imbalance-Mitigated
Marks bullish and bearish FVGs and shows when a zone has been mitigated.
View on TradingView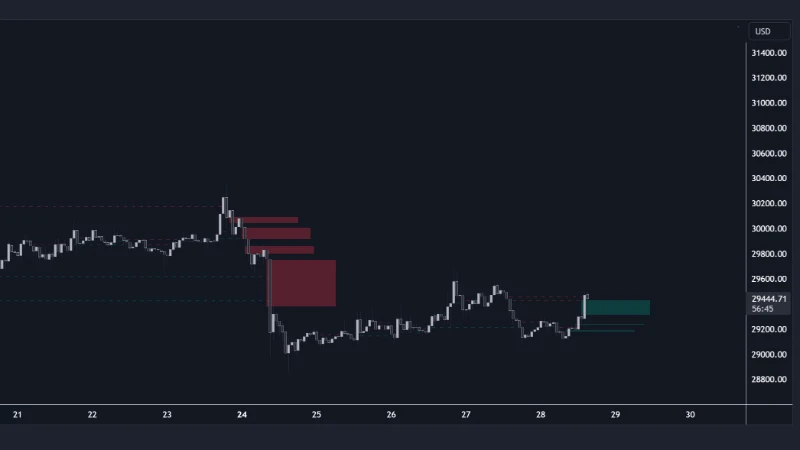
Fair Value Gap [LuxAlgo]
Draws bullish and bearish FVG zones and tracks how many of them get filled and how long that takes.
View on TradingView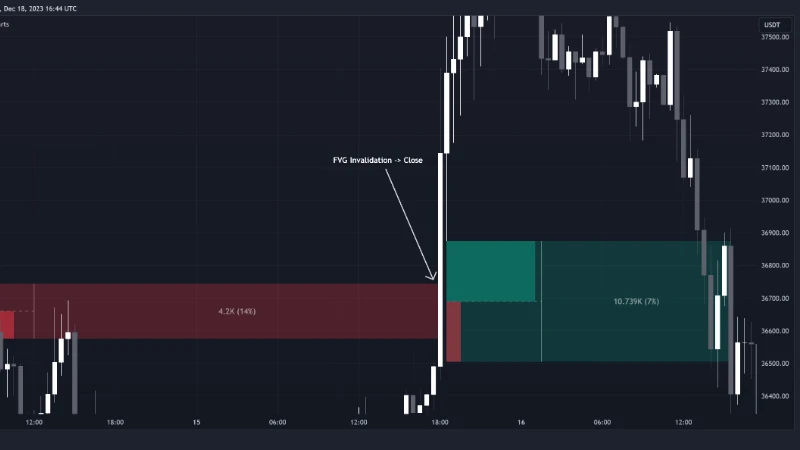
Fair Value Gaps (Volumetric) | Flux Charts
Marks FVG zones and shows the volume traded inside each one, split into buying and selling volume.
View on TradingViewTest Your Fair Value Gap Knowledge
Eight quick questions on marking an FVG, its 50% level, invalidation and look-alike gaps. Each answer links back to the section that explains it.
ABCD Answer with your keyboard
-
01In a bullish FVG (BISI), which two levels mark the edges of the gap?
A bullish gap runs from the wick high of candle 1 up to the wick low of candle 3. Opens and closes are candle bodies, and marking body to body is a common error. Low of candle 1 to high of candle 3 is the bearish version. Review: How to Mark a Fair Value Gap Correctly
-
02A large bearish candle 2 forms, but the high of candle 3 reaches slightly above the low of candle 1. What do these three candles form?
For a bearish gap to exist, the high of candle 3 must stay below the low of candle 1. If the wicks of candle 1 and candle 3 overlap, even slightly, there is no gap. A big middle candle alone is not enough. Review: How to Mark a Fair Value Gap Correctly
-
03Which detail makes an FVG more meaningful?
A gap that forms right after a liquidity sweep, with clear displacement and in line with the higher-timeframe bias, carries more weight. Tiny gaps and gaps inside choppy ranges are weak, and gaps against the higher-timeframe bias are more likely to fail. Review: Strong vs Weak Gaps
-
04What is Consequent Encroachment (CE)?
CE is the level halfway between the two edges of the FVG. The far edge is where the gap counts as fully filled. A body close through CE does not invalidate the gap on its own; it only shows the zone is being tested more deeply. Review: this section
-
05Price trades back down into a bullish FVG. Which event invalidates the gap?
A gap is invalidated only when a candle body closes beyond its far edge. For a bullish gap, that means a close below its lower edge. A wick that pierces the zone and closes back inside does not invalidate it, and a touch of CE or a partial fill are normal reactions. Review: this section
-
06A candle body closes above a bearish FVG (SIBI). What can the zone become?
After a body close through a gap, its role can flip. A bearish gap that price closes above can start acting as support, and this flipped zone is called an inversion FVG. A BPR needs a bullish gap and a bearish gap overlapping at the same price. Review: this section
-
07Two candles leave a space between their bodies, but their wicks still overlap. What is this called?
A volume imbalance is measured body to body while the wicks still overlap. An FVG needs a gap between the wicks of candle 1 and candle 3, and a price gap has no overlap at all, not even between wicks. Review: FVG Variants and Look-Alike Concepts
-
08Which statement about FVGs is accurate?
Price returning to a gap is a tendency, not a rule. Some gaps are only partly filled, and a breakaway gap is never revisited. FVGs form on every timeframe and are reference zones that traders combine with structure, bias and liquidity. Review: this section
Review your answers
Conclusion
A Fair Value Gap is a three-candle imbalance where the wicks of candle 1 and candle 3 leave an empty space beside a strong middle candle. Mark it from wick to wick, note its 50% level, and treat it as a zone where price may react, not a guaranteed turning point. Context such as displacement, a recent liquidity sweep and the higher-timeframe bias decides how much weight a gap deserves, and a body close beyond its far edge tells you it is no longer valid.
Be the first to share your thoughts on this article.