

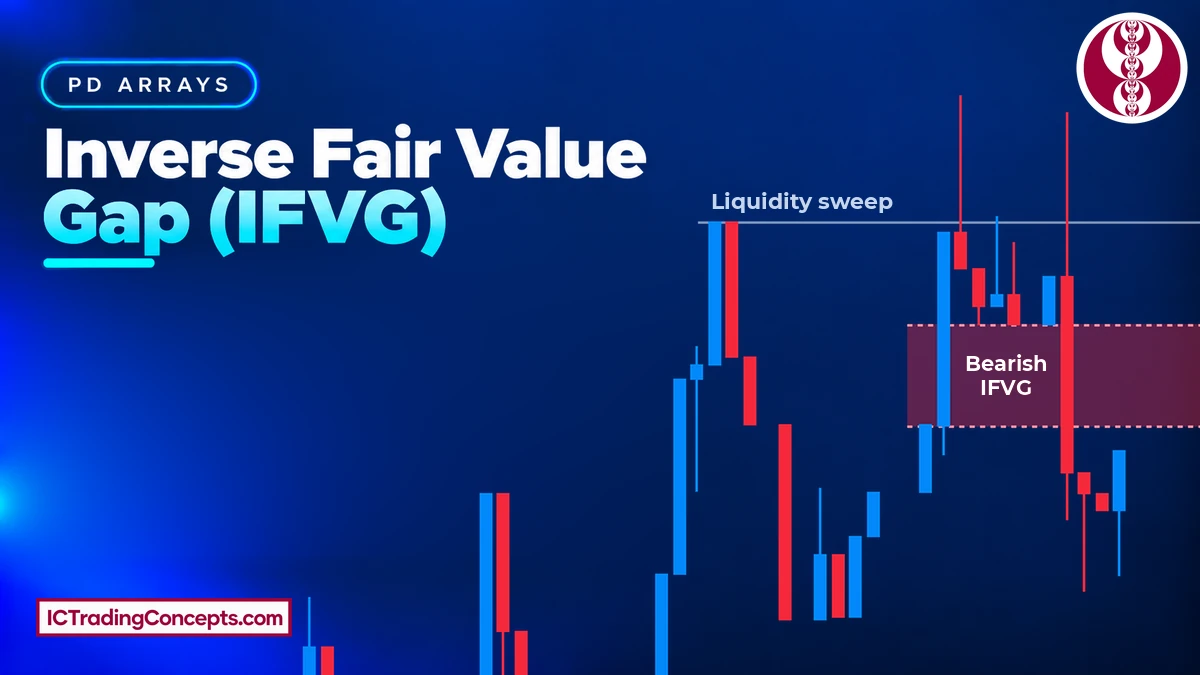
An IFVG, or inverse fair value gap, is a fair value gap that price failed to respect. A candle body closes beyond the gap's far edge, and the zone flips its role. A bearish FVG (SIBI) that price closes above becomes a bullish IFVG that can act as support. A bullish FVG (BISI) that price closes below becomes a bearish IFVG that can act as resistance.
Key Takeaways
- An IFVG forms the moment a candle body closes beyond the far edge of an existing FVG. A wick that pierces the gap and closes back inside does not count.
- The zone keeps the original FVG's wick-to-wick edges and its CE (50%) level. Only its direction changes.
- A bullish IFVG comes from a failed SIBI and is read as bullish. A bearish IFVG comes from a failed BISI and is read as bearish.
- A liquidity sweep, a market structure shift (MSS) and higher-timeframe bias strengthen a setup. None of them is part of the definition.
- Entries come right after the inversion close, or on a retest of the zone's near edge or CE.
What Is an IFVG (Inverse Fair Value Gap)?
An IFVG is an FVG whose original job has failed. In ICT's model, a fair value gap is a three-candle imbalance. The wicks of candle 1 and candle 3 leave a price range that only the middle candle traded through. Price usually returns to that range, rebalances it and continues in the gap's direction. That continuation logic is the basis of standard FVG trading.
The inverse fair value gap starts where that logic breaks. Price comes back to the gap and does not respect it. Instead, a candle body closes beyond the far edge. From that close on, the same price range is read in the opposite direction:
- Failed SIBI (bearish FVG) → bullish IFVG. The body closes above Candle 1 Low, and the old resistance zone becomes potential support.
- Failed BISI (bullish FVG) → bearish IFVG. The body closes below Candle 1 High, and the old support zone becomes potential resistance.
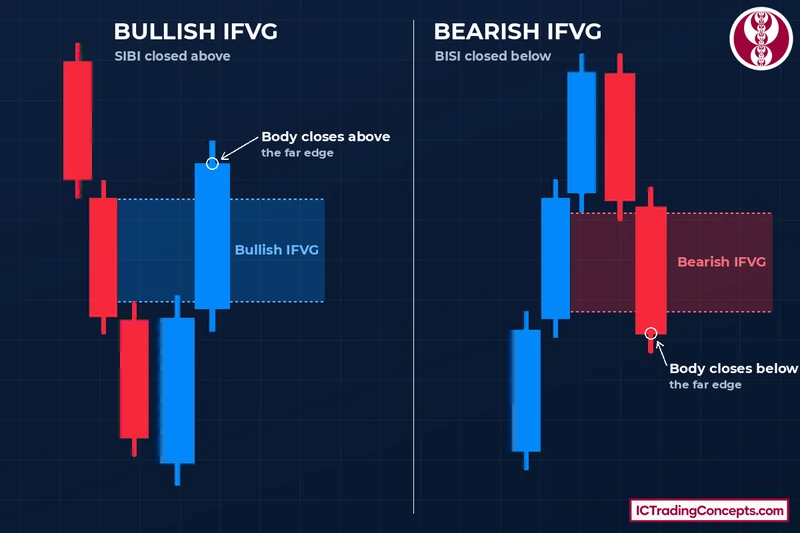
The term comes from Michael J. Huddleston (ICT's official site), whose lessons call it an inversion fair value gap. Many traders shorten it to inverse FVG or simply IFVG. In the ICT IFVG model, the inverted gap is one of the PD arrays, read in its new direction. The IFVG exists as soon as the body close happens. It does not need a retest, a liquidity sweep or a structure shift to be valid. Those belong to the context that decides whether a given inversion is worth trading.
How Does an Inversion Fair Value Gap Form?
Every inversion follows the same four-step sequence, whatever the market or timeframe:
- Price delivers in one direction and leaves an FVG behind.
- Price returns to the gap.
- Instead of rebalancing and continuing, price trades through the gap, and a candle body closes beyond its far edge.
- The failed gap is relabelled as an IFVG in the new direction. Its next test is read from the other side.
The far edge is the boundary price reaches last. For a SIBI, price arrives from below, so the far edge is its top (Candle 1 Low). For a BISI, price arrives from above, so the far edge is its bottom (Candle 1 High).


Bullish IFVG (Bearish FVG Closed Above)
A bullish IFVG starts as a SIBI left by a sell-off. Sellers created the gap, and it should act as resistance when price returns. When a candle body closes above Candle 1 Low instead, the sellers have lost the zone. The gap now marks the earliest shift of momentum to the buy side, and its next retest is a potential long entry.
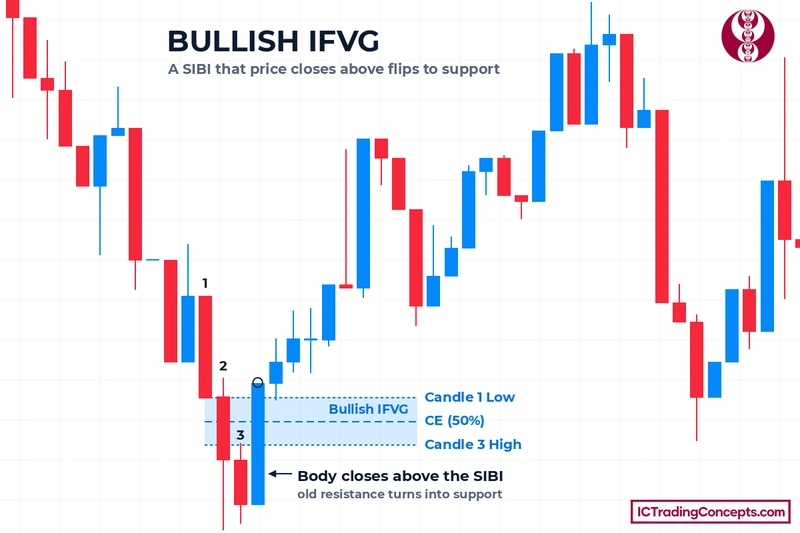
In this IFVG example on a 1-minute chart of a BTCUSDT perpetual futures contract, three falling candles leave a SIBI near the low of the drop. The very next candle, a large bullish one, closes well above the gap's top. Price then stays above the zone and keeps rising.
Bearish IFVG (Bullish FVG Closed Below)
A bearish IFVG is the mirror sequence. A BISI left by a rally should support price on the way back down. When a candle body closes below Candle 1 High, the buyers have failed to defend it, and the zone becomes potential resistance. The bearish IFVG signals fading buy-side momentum, and its retest is a potential short entry.
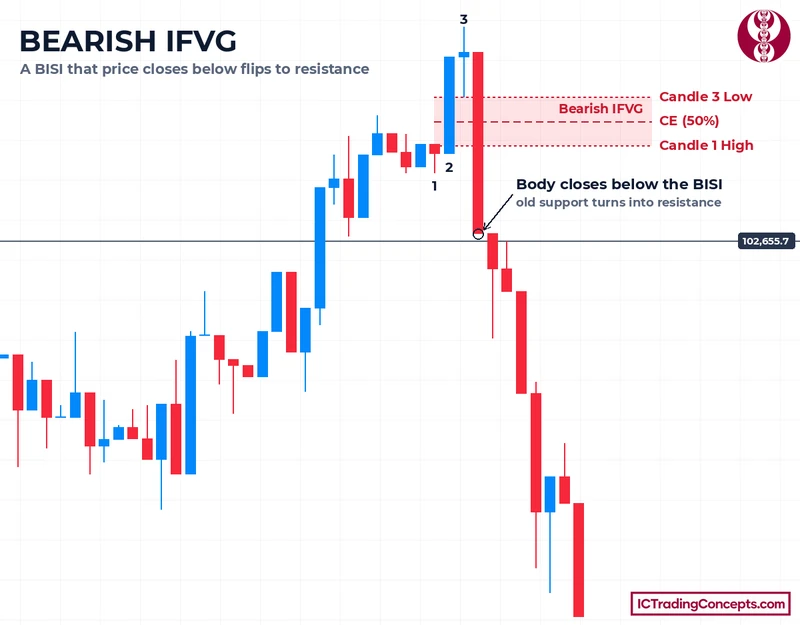
Here, price tops out just above a BISI, and a single large red candle closes below the gap's bottom. The candles that follow never trade back into the zone, and the drop extends for the rest of the move.
How to Mark an Inverse FVG Correctly
Marking an inversion reuses the original gap. Nothing is redrawn from the inversion candle. Work through it in this order:
- Mark the original FVG wick to wick. For a SIBI, from Candle 1 Low down to Candle 3 High. For a BISI, from Candle 1 High up to Candle 3 Low.
- Wait for the candle to close. Judge the close on the timeframe you marked the gap on.
- Confirm the body is beyond the far edge. Above Candle 1 Low for a SIBI. Below Candle 1 High for a BISI.
- Relabel the zone and keep its edges. The inverted zone uses the same high, low and CE (50%) as the original gap.
- Note the near edge and the extreme. The near edge is the boundary price meets first on a retest. The extreme on the other side is where the setup fails.
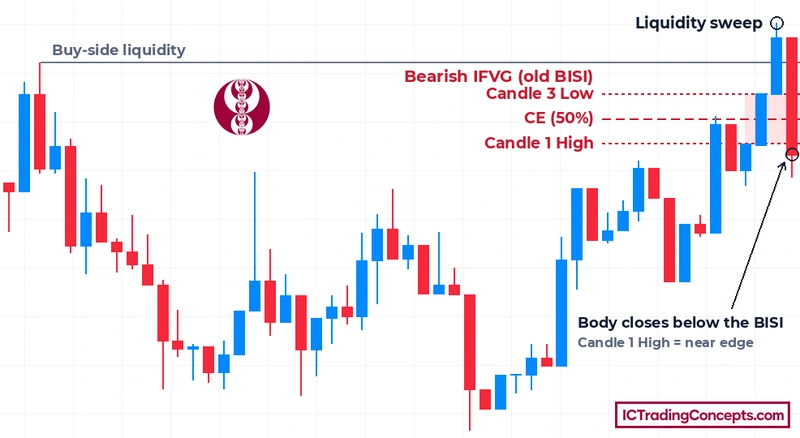
In this 1-minute chart, a BISI forms on the way up. Price then runs above an earlier high, a sweep of buy-side liquidity, and the next red candle closes its body below the BISI. The BISI's top and bottom become the bearish IFVG's edges, and its midpoint becomes the CE. The lower edge, Candle 1 High, is now the near edge for any retest from below.

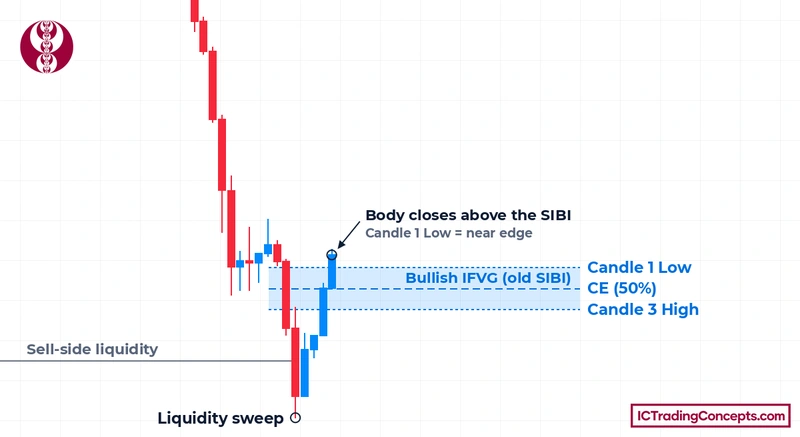
In the 5-minute EUR/USD example, price sweeps sell-side liquidity below an earlier low, and a bullish body then closes above the SIBI.
Body Close vs Wick: When Does an FVG Invert?
The inversion rule is strict on purpose. Only a candle body that closes beyond the far edge inverts the gap. Two situations look similar and do not count:
- A wick pierces the far edge, but the candle closes back inside the gap. The gap was tested and held. It is still the original FVG.
- A body closes inside the gap, even past the CE. That is a deep mitigation of the FVG, not an inversion.
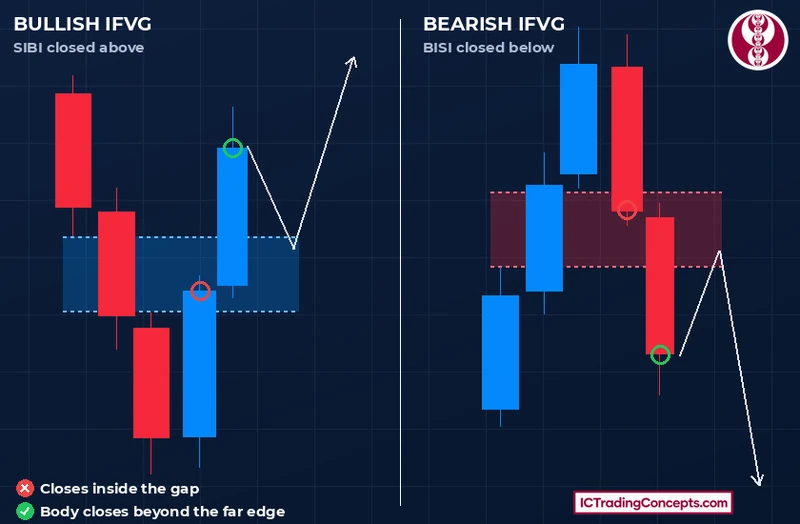
In both panels below, the first candle into the gap closes inside it, so the gap is not inverted yet. The next body closes beyond the far edge and completes the inversion. Each panel then shows the retest that follows.
Why Price Respects an Inverted Gap
In ICT's reading, a fair value gap holds because the side that created it is still in control. Unfilled orders from the impulsive move are thought to sit inside the gap and defend it when price returns. Traders read a body close through the far edge as a sign that those orders were absorbed. In that reading, the imbalance has been consumed, and the side that broke through now controls that price range.
That is why traders expect the zone to flip instead of simply disappearing. The level that defended one direction is now expected to defend the other. It is the same idea as the role reversal in classic support and resistance: broken resistance often becomes support, and broken support often becomes resistance.
On lower timeframes, the IFVG is often the first visible sign of a shift. It can print before a market structure shift confirms the turn. The shift may lead only to a short retracement, or to a full change in direction. The inversion alone does not tell which.
What Separates a Strong IFVG From a Weak One?
Not every inversion deserves a trade. The definition stays the same, but the context around the close changes how much the zone is worth.
| Factor | Stronger IFVG | Weaker IFVG |
|---|---|---|
| Location | Bearish IFVG in the premium half of the dealing range, bullish IFVG in the discount half, or inside a higher-timeframe PD array | Mid-range, with no higher-timeframe level nearby |
| Liquidity | Forms right after a sweep of buy-side or sell-side liquidity | No sweep before the inversion |
| Closing candle | Displacement: a large, one-sided body that closes well beyond the far edge | A slow drift, or a body that barely clears the edge |
| Bias | Points the same way as the daily or higher-timeframe bias | Trades against a strong higher-timeframe trend |
| Structure | Confirmed by a market structure shift (MSS) in the new direction | Price stays inside a choppy range where gaps fail constantly |
One more context is worth knowing: an IFVG after a failed market structure shift. Price shifts structure on the lower timeframe inside a higher-timeframe PD array, but it does not stop at the new FVG. It sweeps the previous high or low and stays inside the higher-timeframe array. The inversion that forms after that failed shift points back in the higher-timeframe direction.

These factors are filters, not conditions: an inversion without them is still an IFVG, just a weaker one.
IFVG vs Breaker Block, BPR and Fake FVG
Several ICT concepts involve a failed or overlapping zone, so they are easy to mix up. The table sets the inverted gap next to its closest neighbours.
| Concept | Built from | What happens | Role afterwards |
|---|---|---|---|
| IFVG | One FVG (BISI or SIBI) | A body closes beyond the gap's far edge | Opposite to the original gap |
| Regular FVG | One three-candle imbalance | Price returns and rebalances the gap | Same direction as the move that created it |
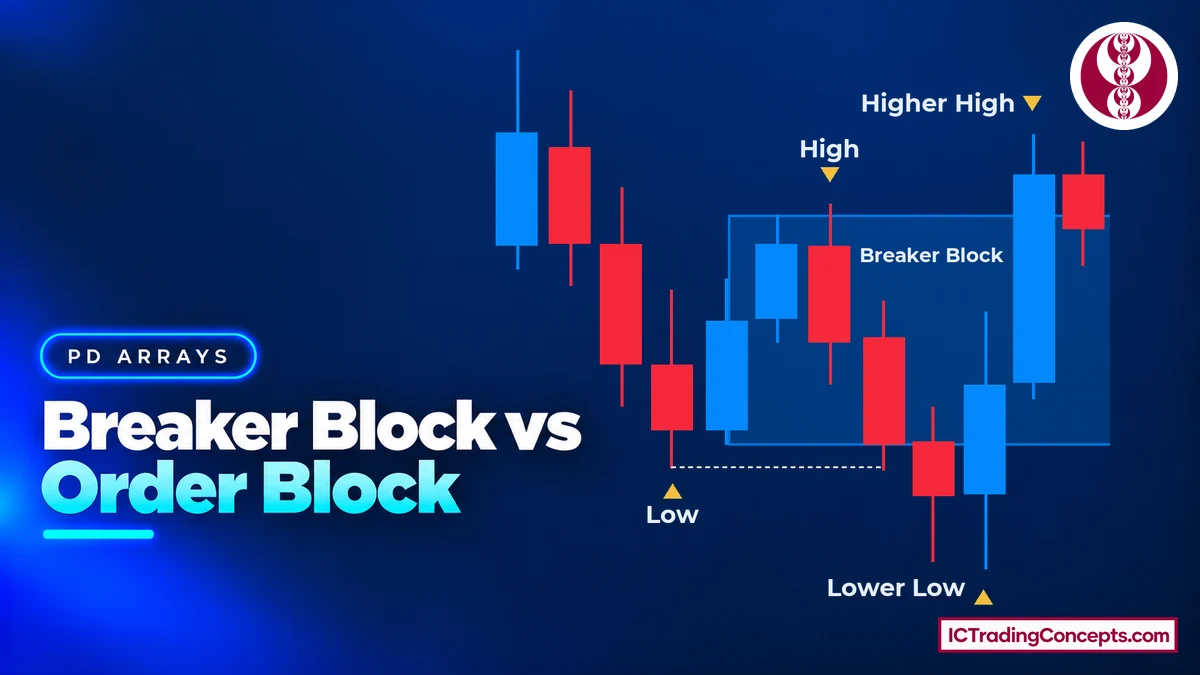
| Breaker block | An order block | A liquidity sweep, then a body close beyond the opposite swing | Opposite to the original block |
| Balanced price range (BPR) | Two opposite FVGs that overlap | A BISI and a SIBI share a price range | One zone where both imbalances meet |
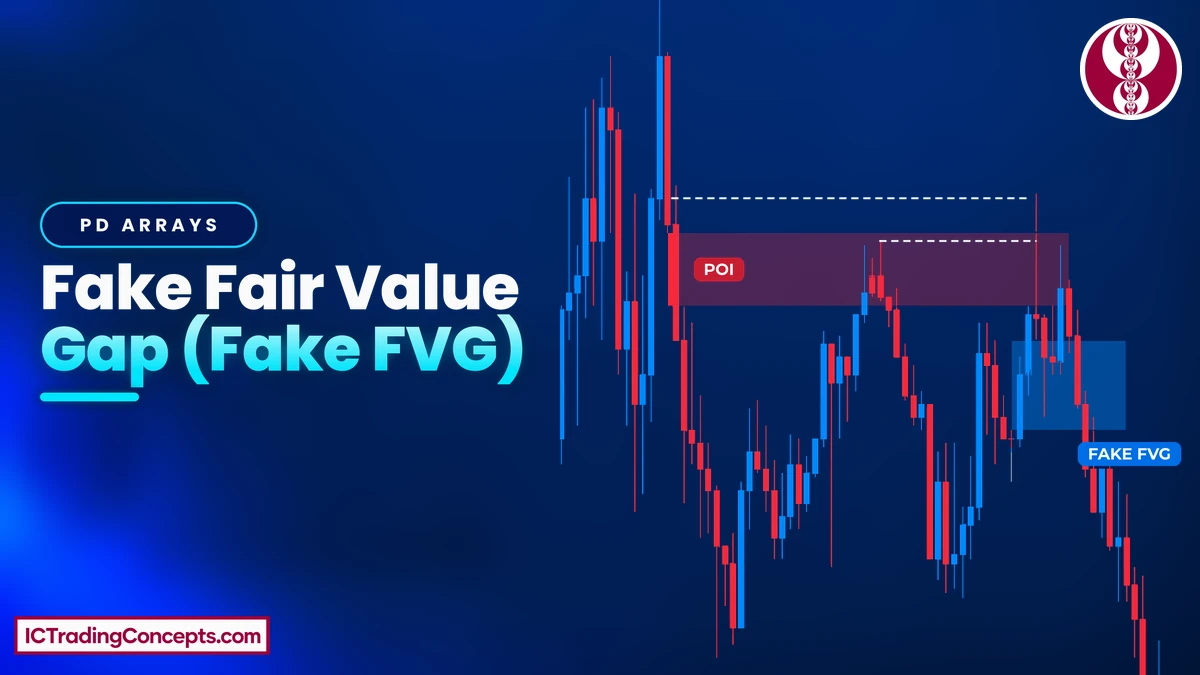
| Fake FVG | An FVG printed on the push into a higher-timeframe POI or toward liquidity | Liquidity is collected and the gap stops holding | Becomes an IFVG once a body closes beyond the far edge |
The breaker block is the closest relative. It applies the same flip to an order block instead of a gap: the failed block works in the opposite direction. Unlike the IFVG, it needs the liquidity sweep first. The FVG vs order block comparison explains how the two source zones differ before either one fails.
A BPR needs two gaps that overlap. An IFVG needs only one gap that failed. A fake FVG looks at the same failure from the other side: the gap that should have held but did not. When that failure ends with a body close beyond the far edge, the trade it offers is the inversion.
How Traders Use the IFVG in Practice
The IFVG is a trigger, not a full strategy. A typical IFVG trading sequence wraps it in context and fixed risk rules:
- Set the bias on a higher timeframe (daily, 4-hour or 1-hour). Note whether price is in premium or discount, and which liquidity it is reaching for.
- Mark the FVGs on the execution timeframe, usually the 15-minute, 5-minute or lower.
- Wait for the inversion close. A body must close beyond the far edge of an FVG that points against your bias.
- Choose the entry. Enter right after the inversion close, or place a limit order at the zone's near edge or at its CE (50%).
- Place the stop beyond the zone's extreme, or beyond the swing that formed the setup, such as the sweep high or low.
- Target the next draw on liquidity, such as an old high or low on the opposite side.
The two entry styles trade certainty for price. Entering on the close catches moves that never come back, but the stop sits farther away. A limit at the near edge or the CE gives a tighter stop and a better reward-to-risk ratio, but some moves leave without a retest.
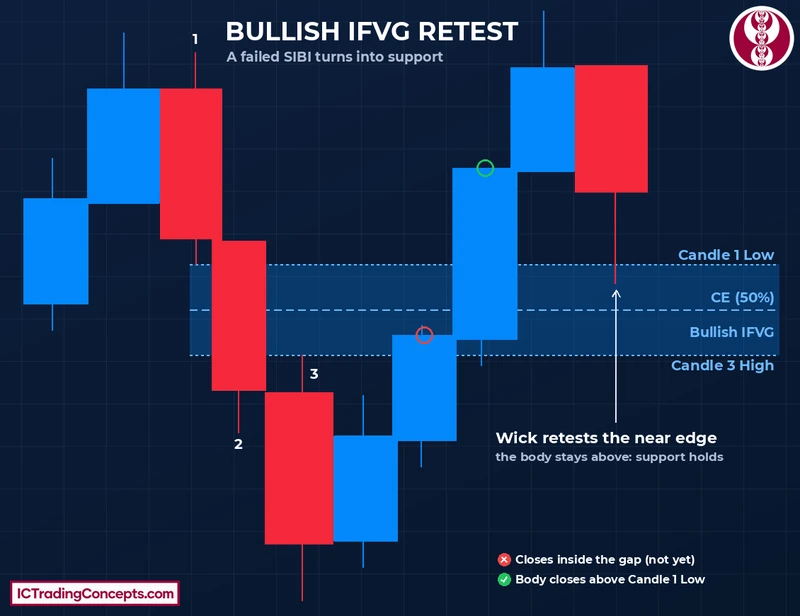
In this bullish example, three falling candles leave a SIBI. Price recovers, and the first candle to reach the gap closes inside it, so nothing has inverted yet. The next body closes above Candle 1 Low and completes the inversion. On the pullback, a wick tags the near edge while the body stays above the zone. A limit order at the near edge would have filled on that wick.


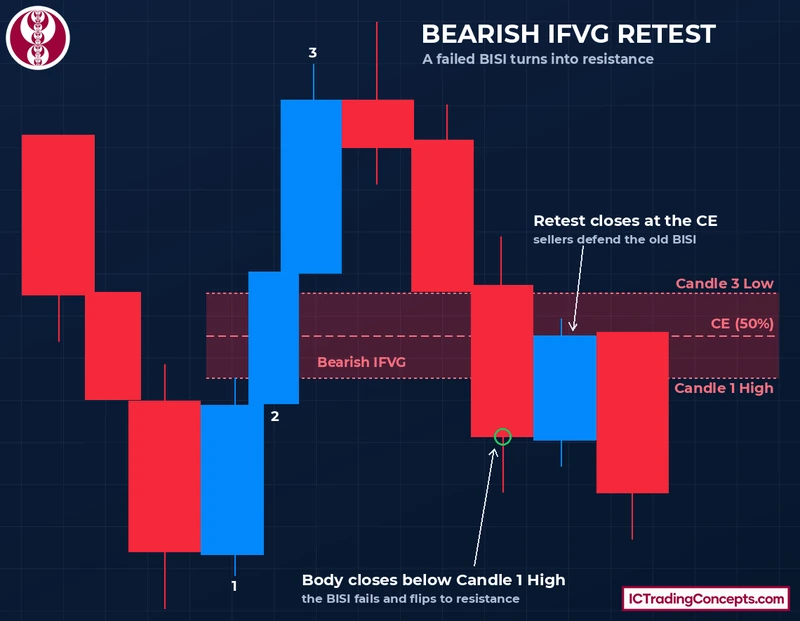
The bearish version starts from a BISI left by a rally. One large red candle opens just above the gap and closes below Candle 1 High. The retest candle climbs back into the zone and closes right at the CE (50%), and the next red candle drops away from it. A short at the CE gets a better price than one at the near edge, with the same stop above the zone.
A 1-minute BTCUSDT walkthrough shows the close-entry version step by step. It starts with a liquidity sweep and a 1-minute FVG broken the other way, then enters on the close with a stop beyond the structure.
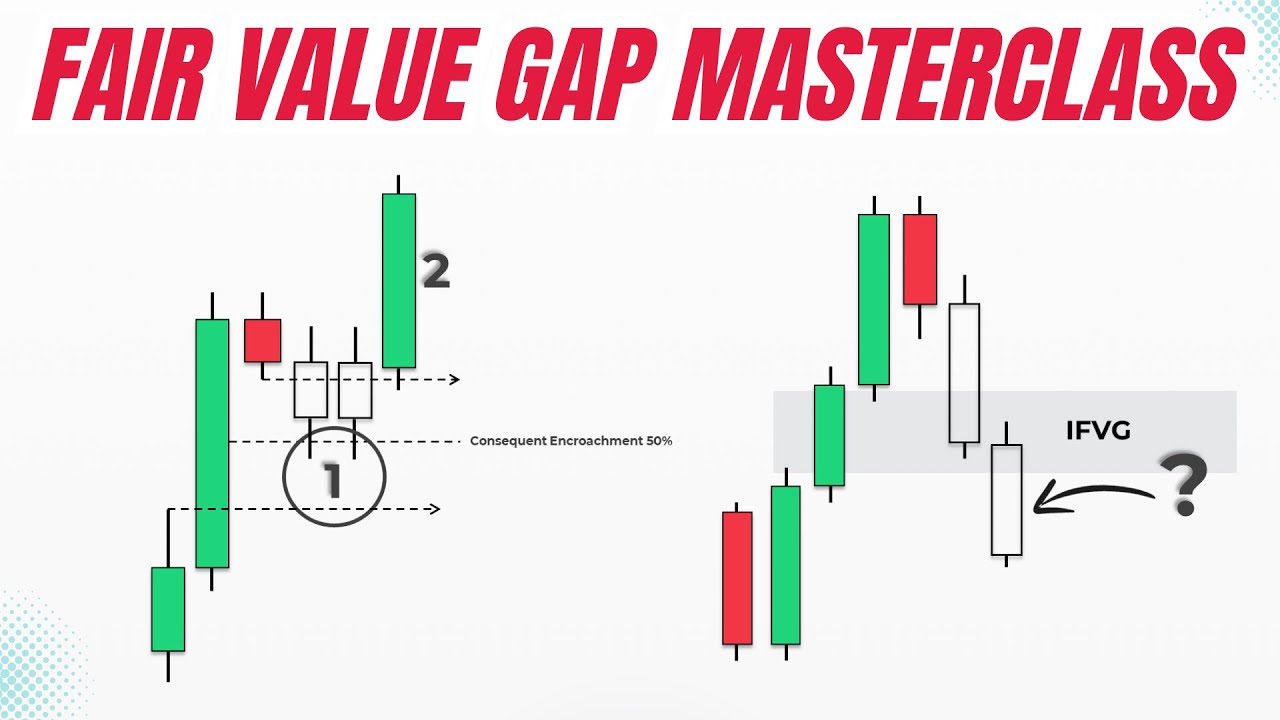
The video below walks through two worked examples of an IFVG strategy. Each starts with a 1-hour bias and a liquidity sweep, then shows a 5-minute inversion with entries at the near edge or at the CE.


Higher Timeframe for Bias, Lower Timeframe for Entry
IFVGs form on every timeframe, but they do two different jobs. On the daily or 4-hour chart, an inversion marks a meaningful shift of momentum and helps set the bias. On the 15-, 5- or 3-minute chart, it times entries inside a higher-timeframe PD array. Very fast charts such as the 1-minute give the tightest entries, but they print many more inversions, and more of them are noise. Higher-timeframe IFVGs tend to be cleaner, so reading two or more timeframes together gives the bigger picture.
Markets Where IFVGs Are Commonly Traded
ICT teaches the inversion largely on US index futures: E-mini Nasdaq-100 futures (NQ) and E-mini S&P 500 futures (ES). Their deep liquidity and session-driven delivery suit the model. Traders apply the same mechanics to major forex pairs such as EUR/USD and GBP/USD, to gold (XAU/USD) and to crypto. Most chart examples in this article come from BTCUSDT; one marking example comes from EUR/USD. Liquid instruments tend to give cleaner inversions than thin ones.
Common Mistakes
Most failed IFVG trades come from a handful of repeatable errors:
- Calling the inversion too early. A wick through the far edge, or a body that closes inside the gap, is not an IFVG. Wait for a body close beyond the far edge.
- Trading the zone in its old direction. After the inversion, the same price range works the other way. A former SIBI is now support, so selling into it repeats the trade that just failed.
- Taking every inversion. Inversions in the middle of a range, against the daily bias or without a prior sweep fail more often. Filter by location, liquidity and bias first.
- Putting the stop inside the zone. Retests often wick deep into the zone. A stop inside it, or one tick past it, can be hit before the move starts. Place it beyond the extreme with a small buffer.
IFVG Indicators on TradingView
An IFVG indicator can mark inversions automatically and alert you when a zone forms or is retested. All three below flip a gap on a candle close through it, the same rule this article uses. Still, check each signal against the marking steps above.
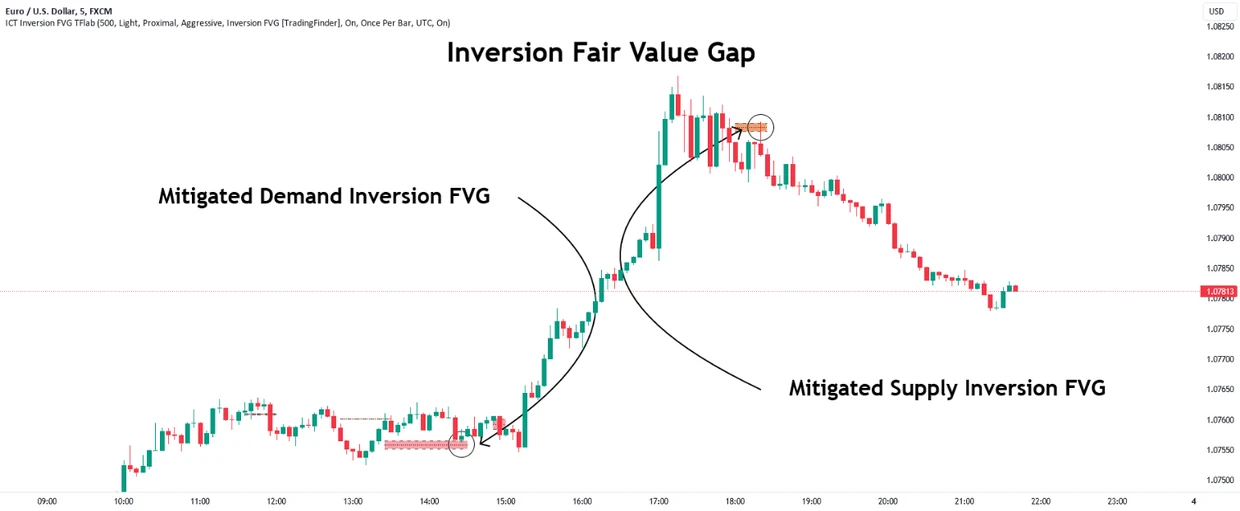
Inversion Fair Value Gaps [TradingFinder] IFVG ICT Signal| Alert
Marks a bullish IFVG when price closes above a bearish FVG. It marks a bearish IFVG when price closes below a bullish FVG and can send alerts.
View on TradingView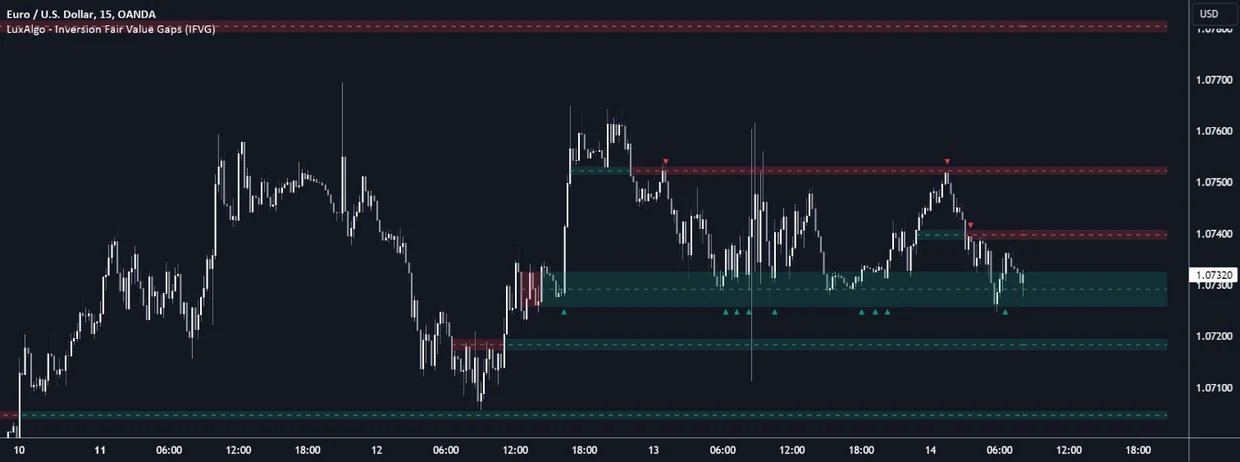
Inversion Fair Value Gaps (IFVG) [LuxAlgo]
Turns an FVG into an inversion zone once price closes through it against its original bias. It flags retests of the new zone and removes the zone after price closes back through it.
View on TradingView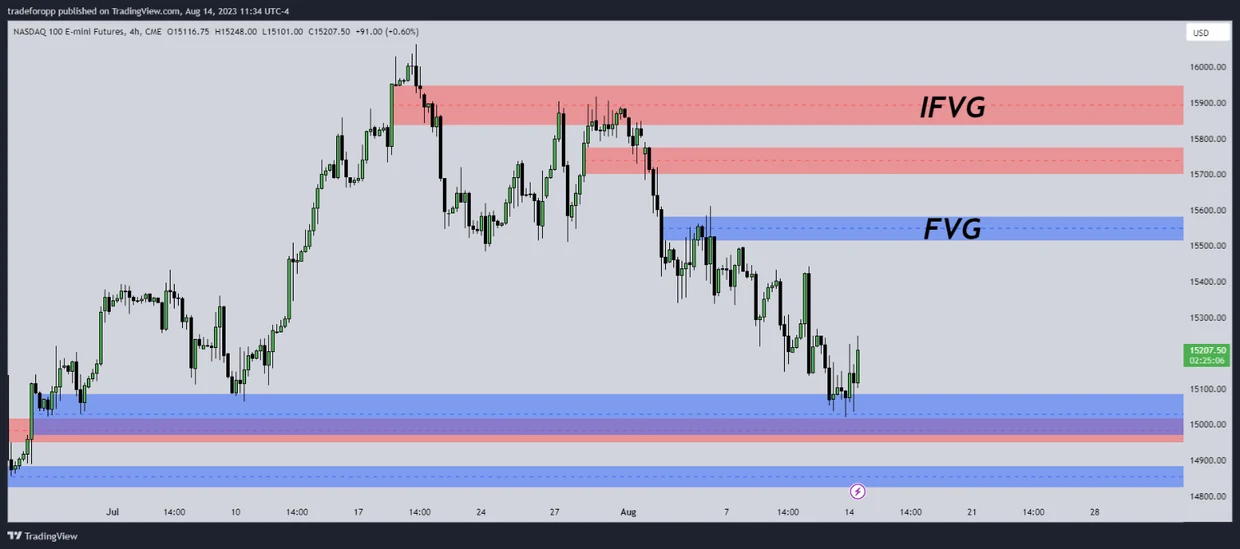
Inverse FVG with Rejections [TFO]
Keeps each FVG until price fully closes through it, then tracks the IFVG until price closes through again. It can also mark swing rejections from FVG and IFVG zones.
View on TradingViewTest Your IFVG (Inverse Fair Value Gap) Knowledge
Eight quick questions on the inversion close, the far edge, marking the zone, context filters, entries, stops and the breaker block. Each answer links back to the section that explains it.
ABCD Answer with your keyboard
-
01When does a fair value gap become an IFVG?
Only a body close beyond the far edge inverts the gap. A wick that closes back inside is a test of the FVG, and a body that closes inside the gap, even past the CE, is a deep mitigation. Review: this section
-
02A candle body closes above a bearish FVG (SIBI). What does the zone become?
A failed SIBI flips into a bullish IFVG. The sellers lost the zone, so the old resistance becomes potential support, and its retest is a potential long entry. Review: this section
-
03For a BISI (bullish FVG), which edge is the far edge that a body must close below?
Price reaches a BISI from above, so its far edge is the bottom, Candle 1 High. For a SIBI the far edge is the top, Candle 1 Low. Review: How Does an Inversion Fair Value Gap Form?
-
04How is an inverse FVG marked after the inversion close?
Nothing is redrawn from the inversion candle. The zone keeps the original gap's high, low and CE (50%); only its label and direction change. Review: How to Mark an Inverse FVG Correctly
-
05What is the role of a liquidity sweep in an IFVG setup?
The IFVG exists as soon as the body close happens. A prior sweep, an MSS and higher-timeframe bias are filters that make an inversion stronger, not conditions. Review: What Separates a Strong IFVG From a Weak One?
-
06Which entry options does this guide give for an IFVG?
Entering on the close catches moves that never come back, with a wider stop. A limit at the near edge or the CE gives a tighter stop and a better reward-to-risk ratio, but some moves leave without a retest. Review: How Traders Use the IFVG in Practice
-
07Where should the stop go on an IFVG trade?
Retests often wick deep into the zone, so a stop inside it, or one tick past it, can be hit before the move starts. Place it beyond the extreme, or beyond the sweep high or low. Review: Common Mistakes
-
08How does an IFVG differ from a breaker block?
Both flip a failed zone. The breaker starts from an order block and needs a sweep, then a body close beyond the opposite swing. The IFVG needs only one FVG and a body close beyond its far edge; two overlapping gaps describe a BPR. Review: IFVG vs Breaker Block, BPR and Fake FVG
Review your answers
Conclusion
The IFVG turns a failed fair value gap into a usable level. The rule is short: a candle body closes beyond the gap's far edge, and the zone flips from resistance to support, or the reverse. Mark it with the original gap's edges and CE, enter on the close or on a retest, and keep the stop beyond the extreme. Location, a prior liquidity sweep, displacement and higher-timeframe bias decide which inversions are worth trading. The definition itself never needs them.
Sources
- The Inner Circle Trader, home page: ICT's official site
- E-mini Nasdaq-100 overview: CME Group
- E-mini S&P 500 overview: CME Group
- Perpetual futures: Wikipedia
- BTCUSDT 1-minute inversion walkthrough: TradingView idea
- Inverse fair value gap entry examples (EUR/USD, 1-hour and 5-minute): Smart Risk, YouTube
Be the first to share your thoughts on this article.