

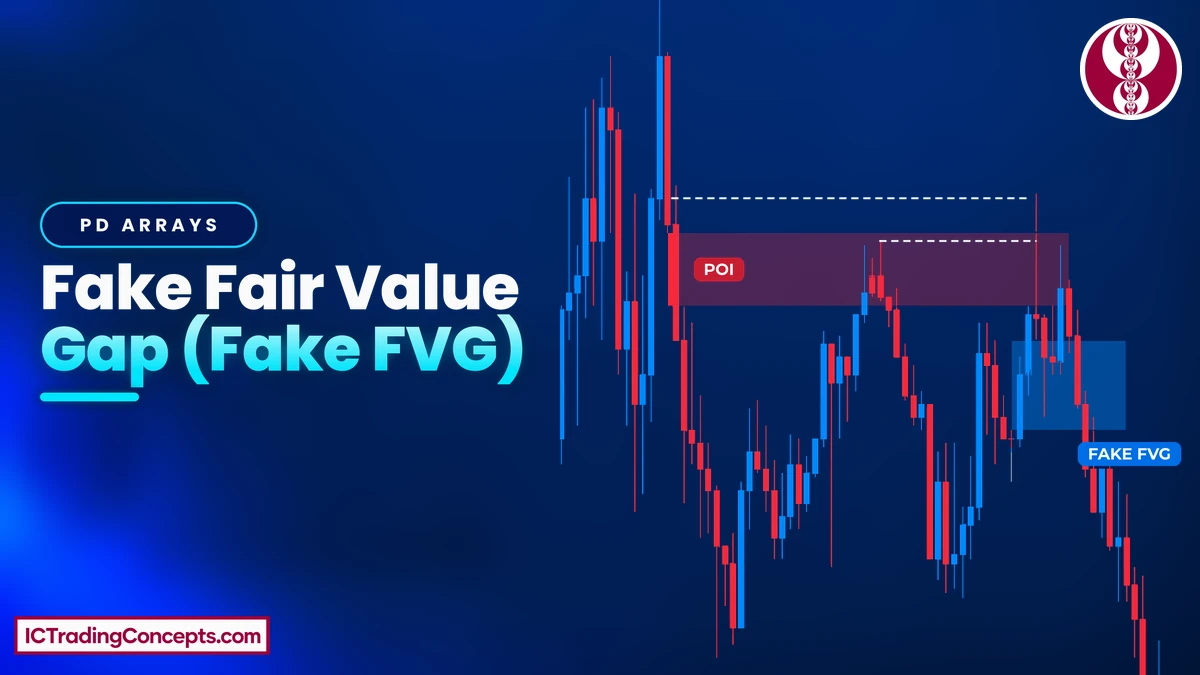
A fake FVG is a fair value gap printed while price pushes into a higher timeframe POI or toward a pool of liquidity. It exists to pull traders onto the losing side. Once that liquidity is collected, the gap loses its validity: a small bounce is possible, but in most cases price closes back through it and the zone flips. The gap worth trading comes after it, on the opposite side.
Key Takeaways
- A fake FVG shows up on the approach to a valid higher timeframe POI, or just before a liquidity level gets swept.
- When liquidity is collected before price revisits the gap, treat the gap as invalid; in most cases it ends up inverted.
- Give an FVG credit only after a decisive structure break backed by displacement. A sweep made of a single wick does not qualify.
- Once the trap fails, look for the FVG that forms against it, or use the inverted zone itself as the entry.
What Is a Fake FVG (Fake Fair Value Gap)?
A fake FVG is a fair value gap built to catch traders rather than to hold price. The model labels it a manipulation fair value gap: an imbalance that prints while price is still travelling toward a valid higher timeframe POI.
Visually, nothing separates it from an ordinary three-candle imbalance. The difference lies outside the gap: which higher timeframe POI or liquidity level price is heading for, and how price behaves once it arrives. The one factor that tells a gap that holds from a gap that fails is liquidity, and traders who leave it out of the read end up picking the wrong gap.
After that liquidity is gone, the fake gap may produce a shallow bounce before price breaks back through it, and a fresh FVG appears on the opposite side. That second imbalance is the tradable one.
Is an Invalid FVG the Same as a Fake FVG?
Yes. Here, "fake", "invalid" and "manipulation" are three names for one thing: a gap whose validity ends once a key liquidity level is collected. That turns the invalid FVG question in ICT terms into a simple test. The closest gap stays in play for as long as the draw on liquidity remains untouched; if that liquidity is taken before price comes back, the gap no longer counts.
How a Fake FVG Forms
Two situations produce a fake FVG: price driving into a valid higher timeframe POI, and price sweeping a liquidity level before it returns to the gap. Both unfold in the same order:
- Price approaches a higher timeframe POI or a resting liquidity level.
- The approach is fast and forceful, and it leaves an imbalance behind.
- Traders without the higher timeframe view buy that gap, some on the first bounce and some with resting limit orders inside it.
- Price tags the POI or collects the liquidity. Because it did not come back to the gap first, the FVG has lost its validity.
- A brief bounce may follow, then price closes through the gap and a new FVG forms the other way.
Bullish Fake FVG
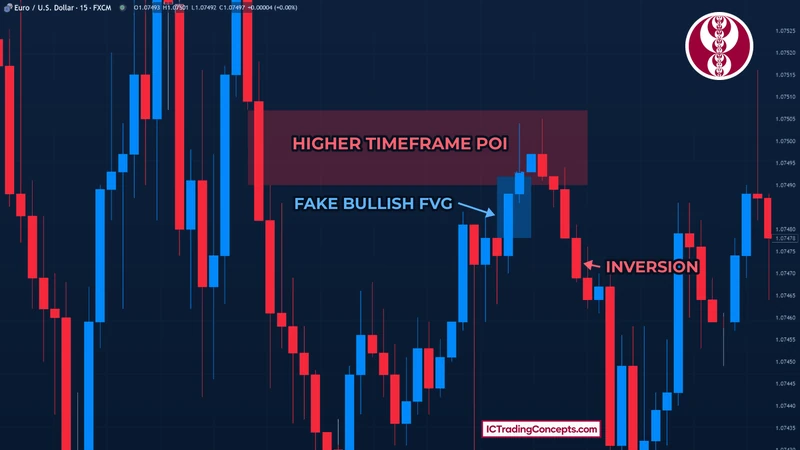
A bullish fake FVG appears during a rally toward a bearish PD array or a higher timeframe POI. The steep climb leaves one or more bullish gaps that look like support to anyone reading them in isolation. As soon as price reaches the POI, or runs the liquidity resting above, those gaps stop being valid.


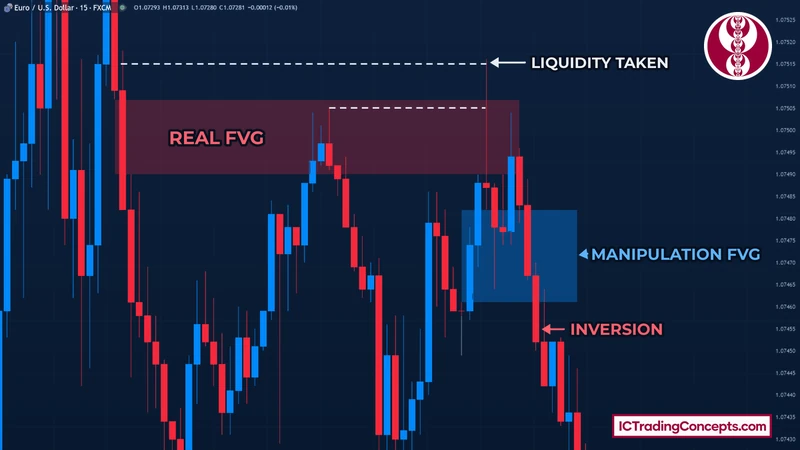
On the EURUSD 15m chart, a rally ran a liquidity level with a strong, impulsive candle, and that impulse left a bullish FVG behind. Buyers who missed the sweep entered inside the gap or parked buy limits there. Instead of holding, the gap was broken and flipped against them (an inversion), and price respected the bearish FVG that formed during the drop.
Bearish Fake FVG
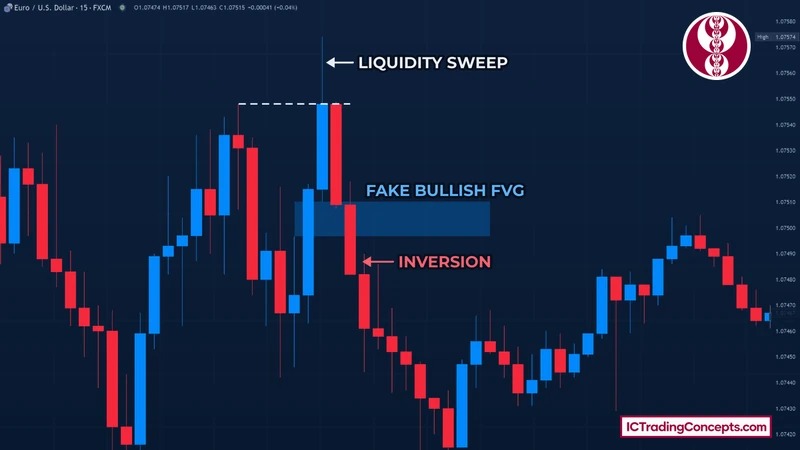
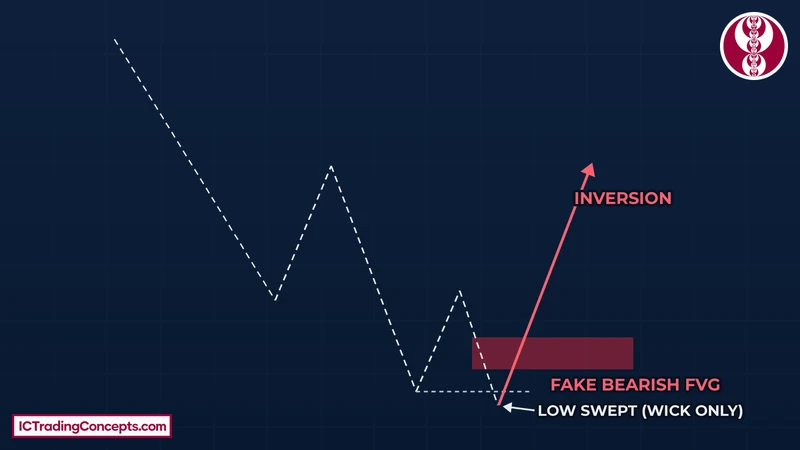
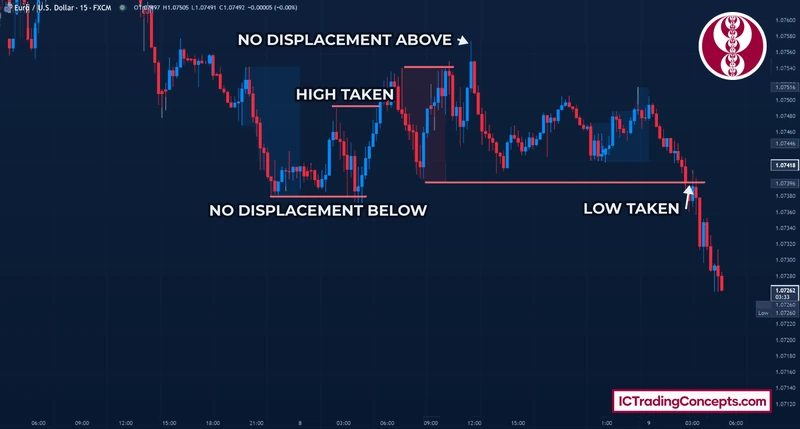
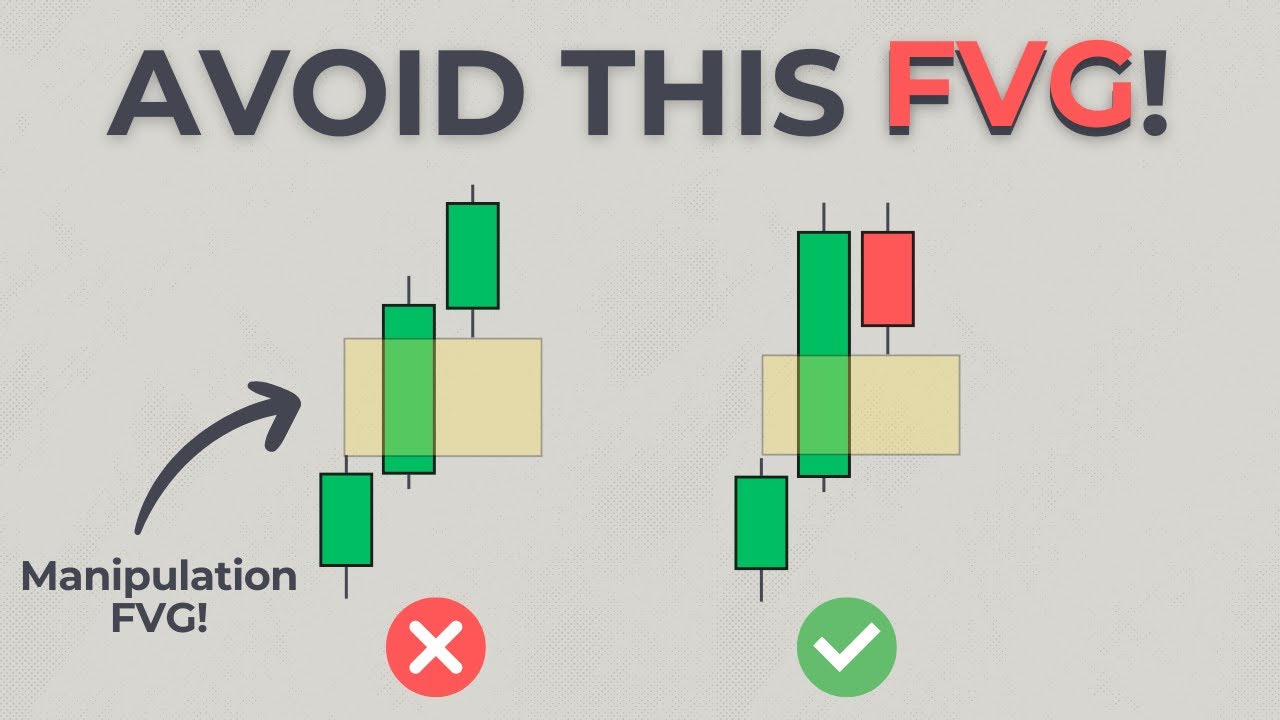
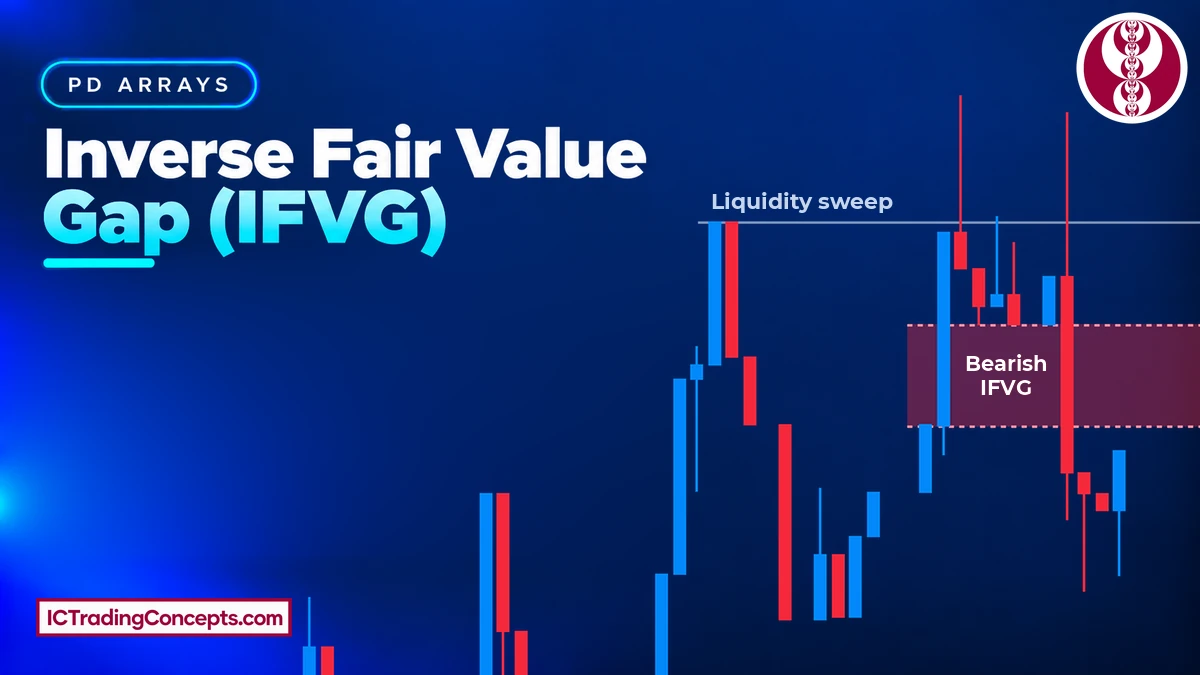
The bearish version is the same trap pointing down. Price steps lower through a series of lower highs, then a single wick dips beneath the previous low, and the drop leaves a bearish FVG behind. That low was pierced by a wick alone, with no displacement beneath it. This makes the gap an invalid bearish FVG, so skip it. In most cases price climbs back through it and the zone flips, as the diagram below shows.
The rule matches the bullish case. When sell-side liquidity is swept before price returns to the gap, the gap stops counting, and the next imbalance can appear on the move back up. Whichever gap forms after the sweep, take it in line with the trend rather than against it.
How to Identify a Fake FVG
At the moment it prints, a fake FVG cannot be told apart from a real one, so the evidence comes from its surroundings. Put four questions to any gap near a key level:


- Where did it form? A gap created on the way into a valid higher timeframe POI should be treated as a manipulation FVG.
- Was liquidity taken first? If the liquidity level was collected before price revisited the gap, the gap is invalid. The sweep is what shows you which gap to distrust and which one to rely on.
- Did price displace, or only wick? A run above a high that fails to displace beyond it sends price, in most cases, back toward the low that produced that high. A failed run below a low works the other way. Rely on a gap only after a decisive structure break with displacement. If all you see is a sweep, typically a lone wick through the level, leave that gap alone.
- What did price do next? Judge the gap by the candles that follow it, not by the gap on its own.
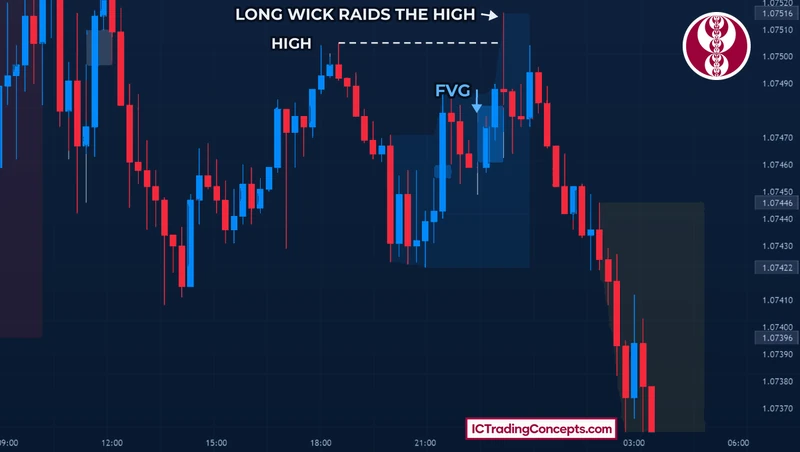
The fourth question is easy to overlook. On this EURUSD 15m chart the gap itself looked ordinary. What gave it away was the next move. A long wick raided the prior high and kept going until it reached an order block. That was a clear sign that buying there made no sense.
Why Price Creates Fake FVGs
It comes down to filling orders. A participant who wants to sell size near a level needs counterparties to absorb those large sell orders. A fresh FVG ranks among the simplest ways to attract buyers, because a gap read without the higher timeframe picture looks like an easy long.
That is why the trap catches traders who skipped the higher timeframe POI. They spot a new bullish gap. Some buy the first bounce, and others leave limit buys inside it. The result is a cluster of buy orders exactly where the larger seller needs them. In the first EURUSD example, the speed and size of the push into the liquidity level is what drew those traders in.
It also changes how a fast approach should be read. A sharp push into your zone is not a warning sign, so a forceful arrival at your FVG, PD array or POI is no reason to hold back from the trade.
Fake FVG vs Real FVG
Real and fake FVGs do not differ in size or shape. What separates them is whether liquidity and displacement still support the gap. The model boils down to this:
| Fake FVG | Real FVG | |
|---|---|---|
| Where it forms | On the approach to a valid higher timeframe POI, or just ahead of a liquidity sweep | After a decisive structure break with displacement |
| Liquidity | Collected before price returns to the gap | Draw on liquidity still untouched |
| Typical reaction | A possible small bounce, then inversion | Price holds the gap and moves on |
| What to do | Skip it and wait for the opposite FVG | Trade it in the direction of the move |
Real FVGs answer to the draw on liquidity as well. While a major draw is still untaken and price is close to it, in most cases price bypasses the gaps further away and heads for the closest gap that still qualifies. That closest gap becomes a manipulation FVG only if price runs the low and then fails to displace beyond it.
Valid vs Invalid FVG Example
This invalid FVG example on EURUSD 15m shows both types in one picture. Price came back into the POI for a second visit. A long wick ran the liquidity resting above two earlier highs. The push left back-to-back bullish FVGs under the zone (the blue box). Buyers inside those gaps got very little before price broke straight through them. The POI that held was the real FVG; the gaps beneath it were the manipulation.

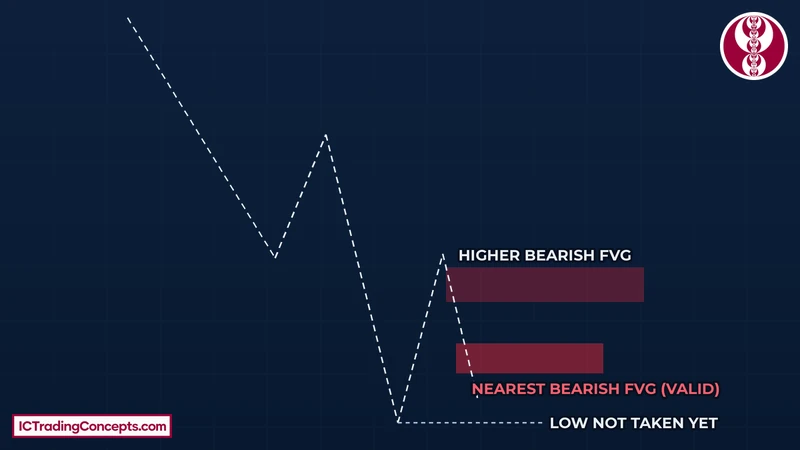
On the bearish side, the diagram below places two bearish gaps above a low that price has not taken yet. With that low still in place, the nearer gap is the one that holds, and price in most cases turns lower from it before reaching the higher gap. Set it beside the bearish fake FVG diagram above to see the contrast. Once a wick sweeps the low and price fails to displace beneath it, the same kind of gap loses its validity.
Trading the Move After the Trap
A fake FVG is useful mainly because it points to the next trade. There are two ways to put it to work.
Trade the FVG in the Other Direction
When the fake gap fails, a new FVG forms against it, and that new gap is the trade, taken in the direction of the fresh move. After a sweep, this opposite gap can appear in more than one spot; any of them works as long as you stay with the trend rather than fight it.
Trade the Inversion
The failed gap can also serve as the entry itself once price has closed through it. In the first EURUSD example, an entry on the inverted zone was available as soon as price broke the gap and started dropping.
The full lesson below walks through these EURUSD charts, covering the sweep, the inversion and the gap price respected afterwards.
Common Mistakes
Fake FVG mistakes share one root: reading the gap without its context. These five are the ones to watch for:
- Treating every FVG as equal. Liquidity decides which gap holds and which fails the test; skipping that check means trading the wrong gaps.
- Hesitating when price arrives fast. A forceful rally up to a bearish PD array scares many traders out of the short, yet that speed is part of the setup, not a reason to stay out.
- Missing the higher timeframe POI. Without it, the bullish gap sitting just under the POI looks like an easy long.
- Judging the gap in isolation. A fresh FVG does not mean price has to keep going; check whether a liquidity sweep happened right next to it.
- Handing the decision to an indicator. An automated FVG tool marks every gap it detects and has no sense of context. It can map the levels; deciding fake or real stays with you.
Indicators That Help
Because an FVG indicator marks every imbalance without judgment, use it to speed up the marking and keep the liquidity and displacement calls for yourself. These three automate the parts of the checklist that can be automated:


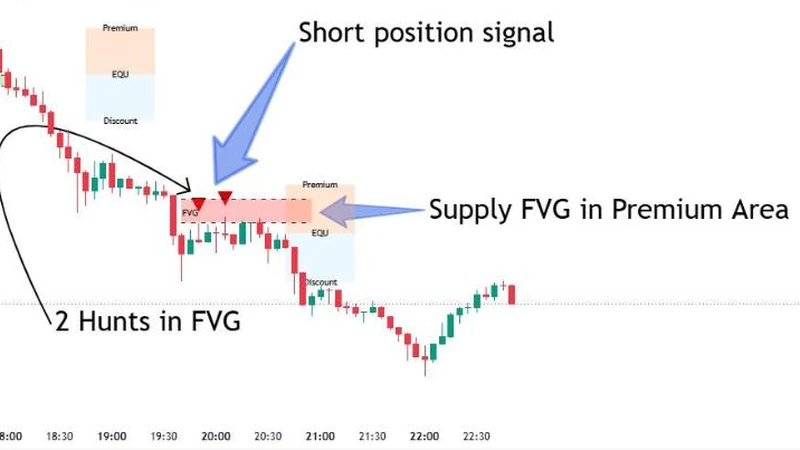
ICT Setup 01 [TradingFinder] FVG + Liquidity Sweeps/Hunt Alerts
Plots FVGs next to liquidity sweeps, so a gap that formed right before a sweep stands out.
View on TradingView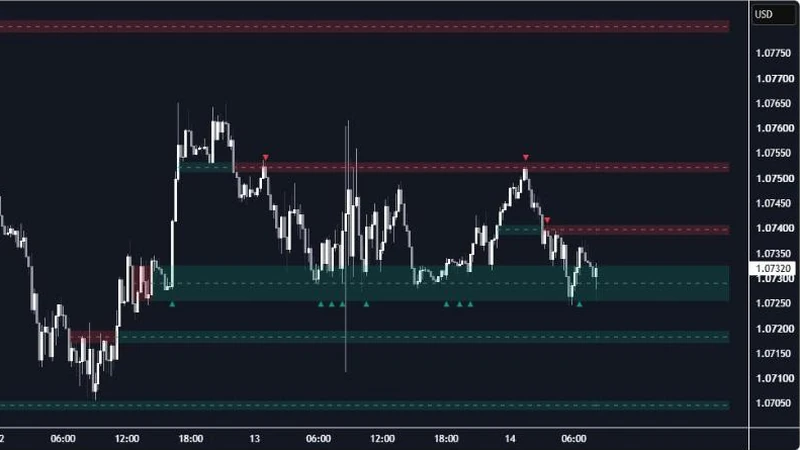
Inversion Fair Value Gaps (IFVG) [LuxAlgo]
Highlights gaps that price has closed through, the inversion that often follows a fake FVG.
View on TradingView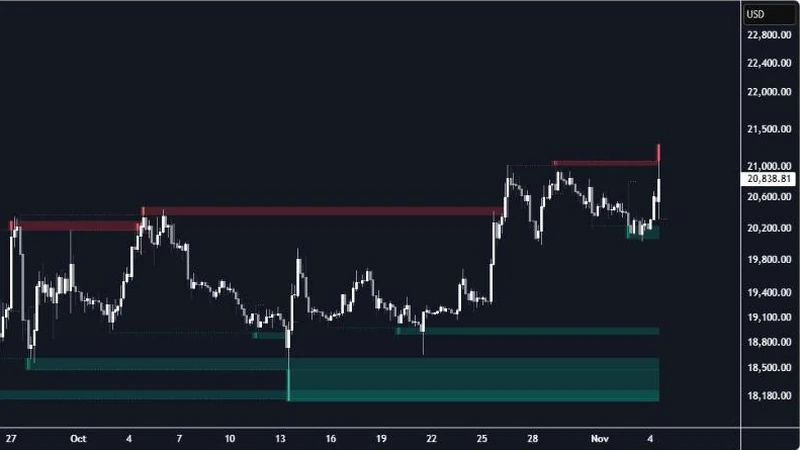
Liquidity Sweeps [LuxAlgo]
Flags swept highs and lows, which speeds up the "was liquidity taken first?" check.
View on TradingViewTest Your Fake FVG (Fake Fair Value Gap) Knowledge
Eight quick questions on where a fake FVG forms, the liquidity test, wick versus displacement, the fake vs real comparison and the two trades after the trap. Each answer links back to the section that explains it.
ABCD Answer with your keyboard
-
01Where does a fake FVG form?
A fake FVG prints while price is still travelling toward a valid higher timeframe POI or a liquidity level. It exists to pull traders onto the losing side. Review: What Is a Fake FVG (Fake Fair Value Gap)?
-
02What do "fake", "invalid" and "manipulation" FVG mean on this page?
The page treats the three words as one idea. The closest gap stays in play while the draw on liquidity is untouched; once that liquidity is taken first, the gap no longer counts. Review: this section
-
03Liquidity was collected before price came back to the gap. What happens to the gap?
If the liquidity level was collected before price revisited the gap, the gap is invalid. A small bounce is possible, but in most cases price closes back through it. Review: How to Identify a Fake FVG
-
04A single wick dips beneath the previous low with no displacement below it, and the drop leaves a bearish FVG. How should you treat that gap?
The low was pierced by a wick alone, with no displacement beneath it, so the bearish FVG is invalid. In most cases price climbs back through it and the zone flips. Review: this section
-
05What must happen before you give an FVG credit?
Rely on a gap only after a decisive structure break with displacement. A sweep that is only a lone wick through the level does not qualify. Review: How to Identify a Fake FVG
-
06Why does price create fake FVGs, according to this page?
It comes down to filling orders. A fresh bullish gap read without the higher timeframe draws buy orders exactly where the larger seller needs them. Review: Why Price Creates Fake FVGs
-
07In the fake vs real FVG table, what is the typical reaction at a fake FVG?
A fake FVG may give a small bounce before price closes back through it. Holding the gap and moving on is the reaction of a real FVG. Review: Fake FVG vs Real FVG
-
08Once the trap fails, what are the two ways to trade it?
When the fake gap fails, a new FVG forms against it and that gap is the trade. The failed gap can also serve as the entry once price has closed through it. Review: Trading the Move After the Trap
Review your answers
Conclusion
A fake FVG is an ordinary-looking gap in the wrong location. It prints on the way into a valid higher timeframe POI or just before liquidity is collected, and its role is to put traders on the losing side. Check where it formed, whether liquidity went first, whether price displaced or only wicked, and what happened next. When the trap fails, trade the gap that forms against it, or use the inverted zone as your entry.
Sources
- Fake FVG Simplified, ICT and SMC traps: Mulham Trading, YouTube
- Market impact: Wikipedia
Be the first to share your thoughts on this article.