

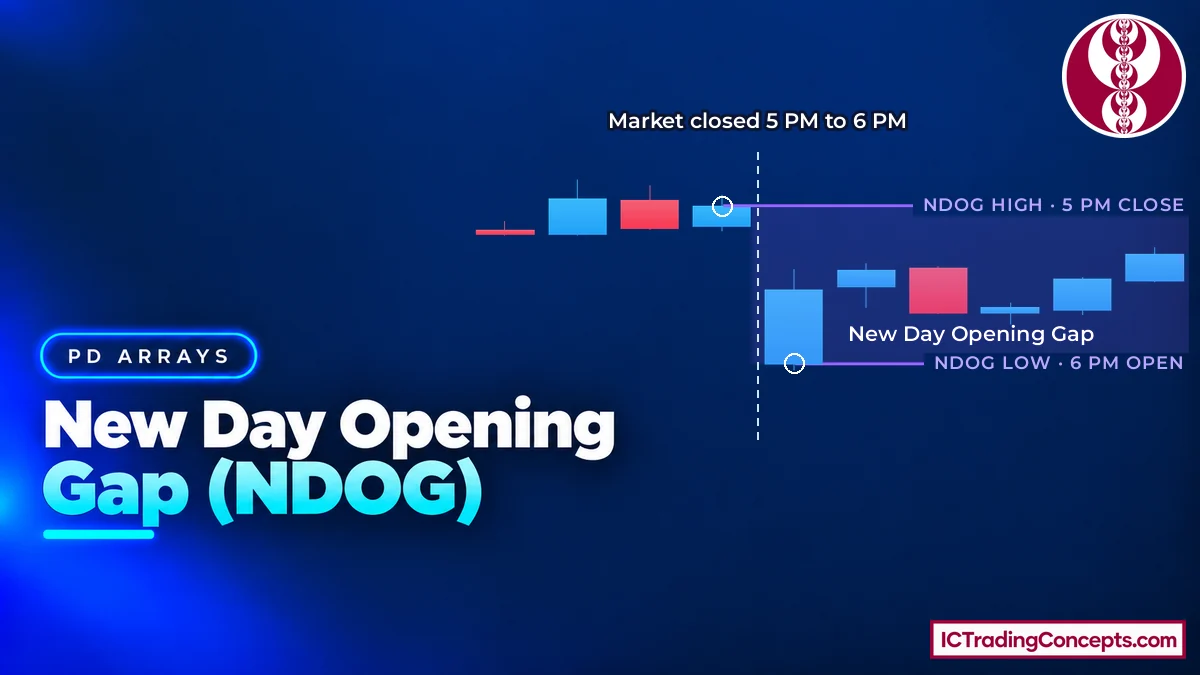
The New Day Opening Gap (NDOG) is the price gap between two reference prices in index futures: the last trade before the 5:00 PM New York halt and the first trade when the market reopens at 6:00 PM. It forms at the Monday to Thursday breaks. Its higher price is the top, its lower price is the bottom, and its midpoint is the consequent encroachment (CE). In ICT trading, the NDOG is a reference level that supports an idea built from other PD arrays, not a standalone signal.
Key Takeaways
- An NDOG uses two prices in New York local time: the last trade before 5:00 PM and the first trade after the 6:00 PM reopen.
- It forms Monday to Thursday. Friday's close to Sunday's open is a new week opening gap (NWOG), not an NDOG.
- The higher price is the top, the lower price is the bottom, and the CE sits at 50% between them.
- This guide uses a five-day lookback for NDOGs, the starting rule ICT describes rather than a fixed limit, and filters out gaps of only one or two ticks.
- Wicks can pierce the gap; candle bodies show whether it is being respected.
What Does New Day Opening Gap (NDOG) Mean in ICT?
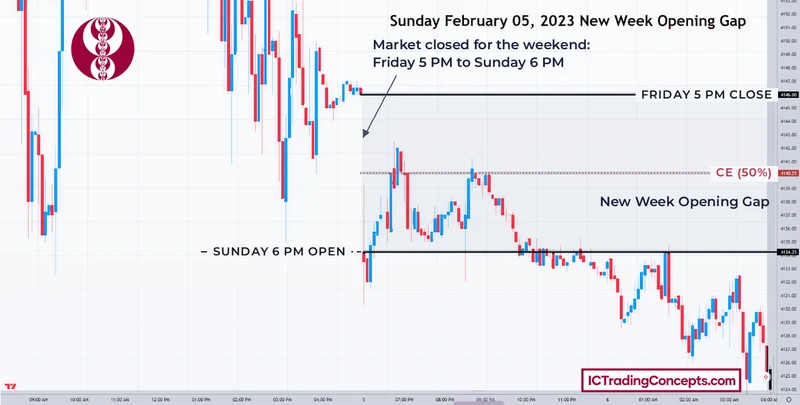
The new day opening gap meaning comes down to one hour. Index futures stop trading at 5:00 PM New York time and restart at 6:00 PM, and the ICT new day opening gap is the space between the price where trading stopped and the price where it restarted. Nothing trades during that hour, so both prices are fixed and visible to everyone: the last trade before the halt and the first trade after the reopen.
ICT treats neither price as random. The closing price ends the previous session, and the opening price is the first price the market offers to start the new one. The range between them becomes a reference area that price can return to, trade around and react at during the following days.
The new day opening gap ICT teaches is a two-price reference, not a candle pattern. It does not need displacement, a liquidity sweep or three candles to exist. It exists whenever the 6:00 PM open prints away from the last trade before 5:00 PM. That is the main difference from a fair value gap, which the comparison section below covers.
How Does the New Day Opening Gap Form?
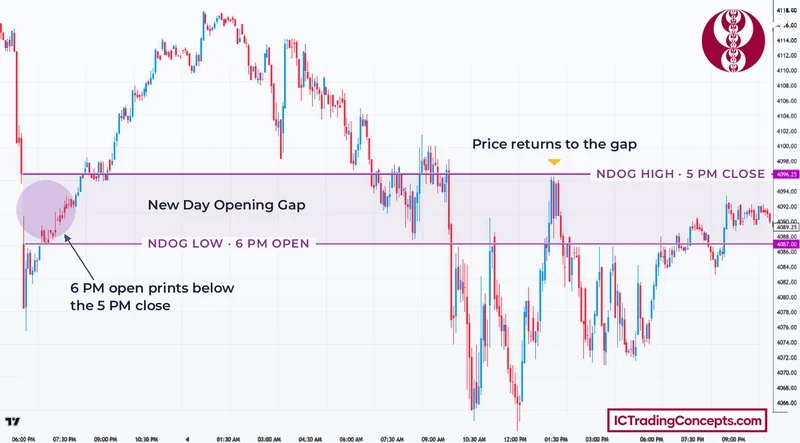
Index futures such as the E-mini Nasdaq-100 trade nearly around the clock from Sunday evening to Friday afternoon, but CME pauses them Monday through Thursday with a daily maintenance period from 5:00 PM to 6:00 PM ET. On Friday the market closes for the weekend and reopens Sunday. That pause is where the NDOG comes from, and it forms in three steps:


- At 5:00 PM New York time the session stops. The last trade before the halt is the first reference price.
- Nothing trades for one hour.
- At 6:00 PM the market reopens. The very first trade is the second reference price, and it starts the new trading day.
If the two prices differ, the space between them is the NDOG.
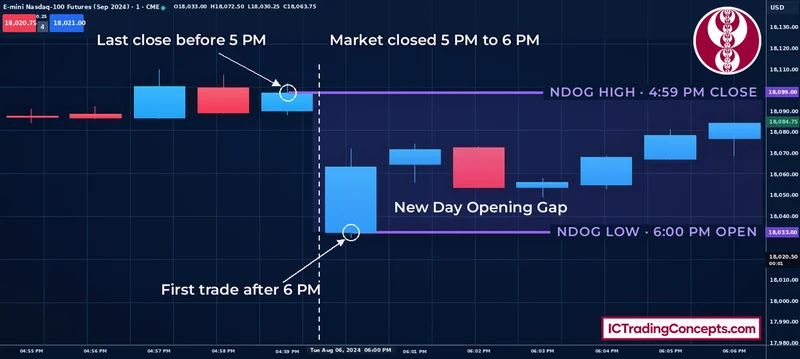
Because the gap prints at the 6:00 PM reopen, it belongs to the next trading day.
Bullish NDOG (Gap Up)
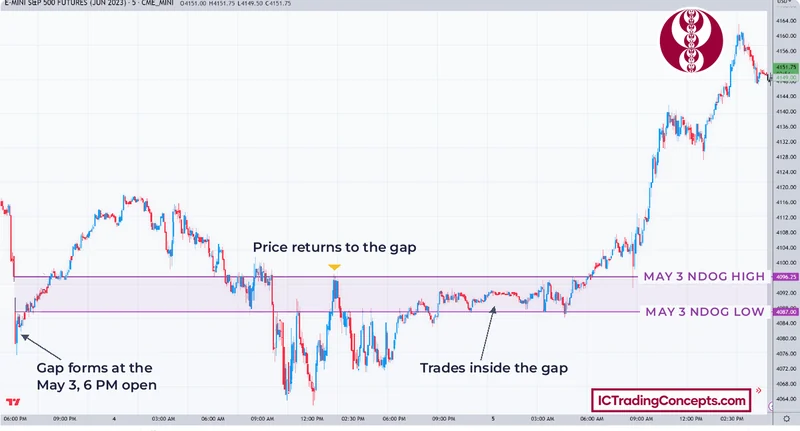
A bullish NDOG forms when the 6:00 PM open prints above the last trade before 5:00 PM. The gap sits below the reopening price: its bottom is the 5:00 PM price and its top is the 6:00 PM price.
"Bullish" here describes only the direction of the gap at the moment it forms. It is not a buy signal, and it does not turn the gap into permanent support. What price does at the gap later is read separately, from candle bodies and from the rest of the analysis.
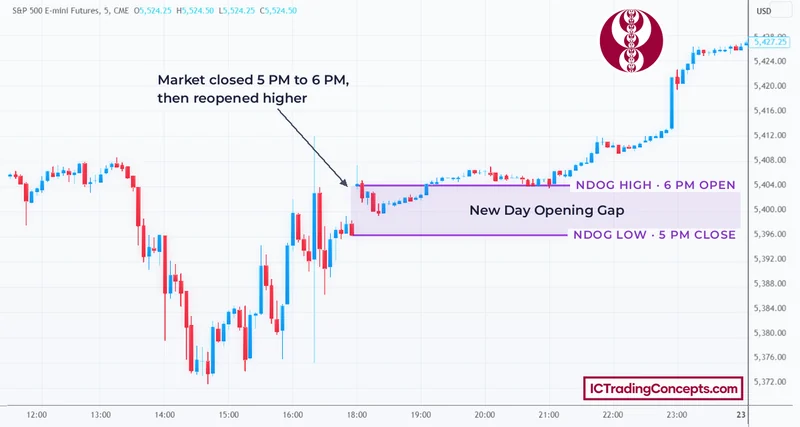
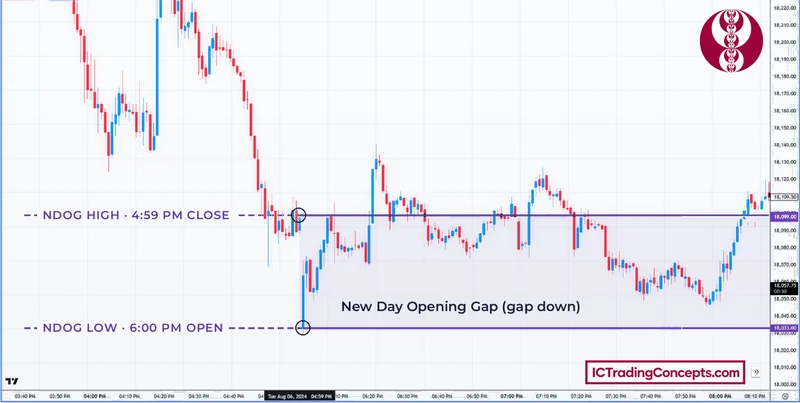
Bearish NDOG (Gap Down)
A bearish NDOG forms when the 6:00 PM open prints below the last trade before 5:00 PM. The gap sits above the reopening price: its top is the 5:00 PM price and its bottom is the 6:00 PM price.
The same limit applies. "Bearish" only names the direction of the gap at formation; it is not a sell signal and not permanent resistance.
Which Markets Form a True NDOG?
An NDOG needs a real trading halt between two sessions. The concept comes from index futures, which ICT teaches on contracts such as the E-mini S&P 500 (ES) and the E-mini Nasdaq-100 (NQ). Both stop at 5:00 PM and reopen at 6:00 PM New York time Monday through Thursday evening.
A market that trades straight through 5:00 PM has no halt to create two separate prices, so it does not form the same gap. That is why the NDOG is read on futures charts. Forex and crypto are covered in the FAQ.
How to Mark a New Day Opening Gap Correctly
Marking an NDOG is mechanical once the chart shows the right prices. The steps below follow the way ICT marks it on an intraday futures chart, always in New York local time:

- Open an intraday chart with electronic trading hours visible. ICT's 5-minute chart lesson marks the gap on that timeframe, and a 1-minute chart shows the exact 4:59 PM candle before the halt.
- Find the last trade before the 5:00 PM halt: the close of the final candle before the break.
- Find the first trade after the 6:00 PM reopen: the open of the first candle.
- Mark the higher of the two prices as the top and the lower as the bottom.
- Mark the midpoint as the consequent encroachment (CE).
- Extend the top, bottom and CE to the right so later price action can be read against them.
Two chart settings can change the result. A regular-trading-hours chart hides the overnight session, so the 5:00 PM and 6:00 PM prices disappear and you end up looking at a different gap. Settings that show settlement prices instead of the last trade, or back-adjust futures contracts, can also shift the two prices. Keep the chart on electronic trading hours and read the actual last and first trades.
Use New York local time for every mark. Broker server time or your own time zone moves the 5:00 PM and 6:00 PM candles and produces the wrong gap.
Finding the NDOG Consequent Encroachment (50% Level)
The consequent encroachment is the 50% level of the gap: the price exactly halfway between its top and bottom. A Fibonacci tool set to 0, 0.5 and 1, drawn from the bottom to the top, marks it in one step. You can also calculate it as (top + bottom) ÷ 2.
The CE matters because price can trade around the middle of the gap, not only its edges. Treat the top, bottom and CE together as one reference area.
NDOG Lookback: Which Recent Gaps to Track
A new gap can form every Monday through Thursday evening, so you need a rule for how far back to look. ICT describes a five-day lookback for new day opening gaps, and a five-week lookback for new week opening gaps. The NDOGs that formed within the last five days are the ones to keep in view; older gaps fall outside the lookback.
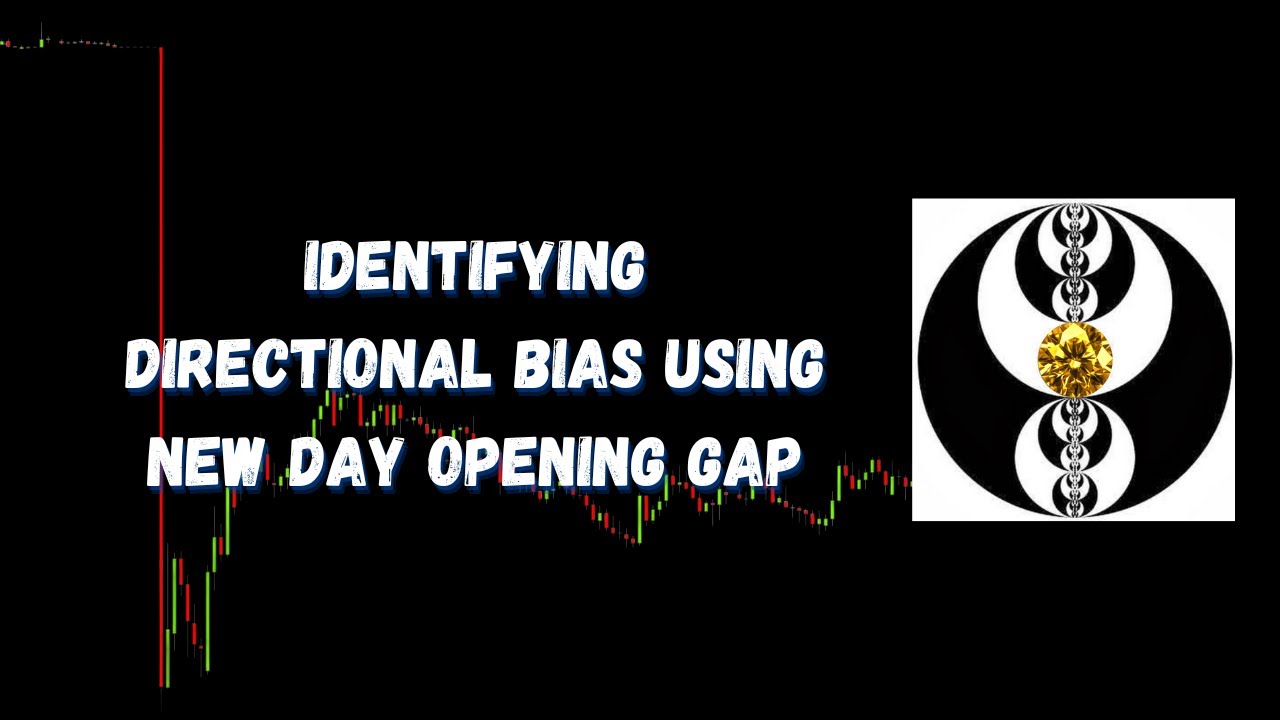
The video below shows the lookback in ICT's own words (from 2:51), starting from the 4:59 PM candle and the 6:00 PM opening price. Besides the lookback used in this guide, the clip also covers keeping gaps longer and logging observations.
Why Price Reacts to the New Day Opening Gap
The NDOG works as a reference because both of its prices are set by the market, not by a drawing choice. The closing price ends one session, the opening price starts the next, and the hour between them leaves a range where no trades took place.
When price comes back to that range in the following sessions, it can react at the top, the bottom or the CE. In ICT's example, price treats an extended NDOG as support, then as resistance, and consolidates around its middle over several sessions before the move continues. In NDOG trading, these reactions are tendencies to watch, not guarantees, and they matter only when they agree with what the rest of the analysis already says.

What Separates a Strong Gap From a Weak One?
Not every NDOG deserves the same attention. Three things separate a gap worth using from one that adds little.
Meaningful size. A one- or two-tick gap is technically still an NDOG, but ICT filters it out for practical use. He gives no fixed number, but prefers a clear separation, generally more than one handle (one full index point) on index futures; on the E-mini Nasdaq-100, the minimum move is a 0.25-point tick (CME).
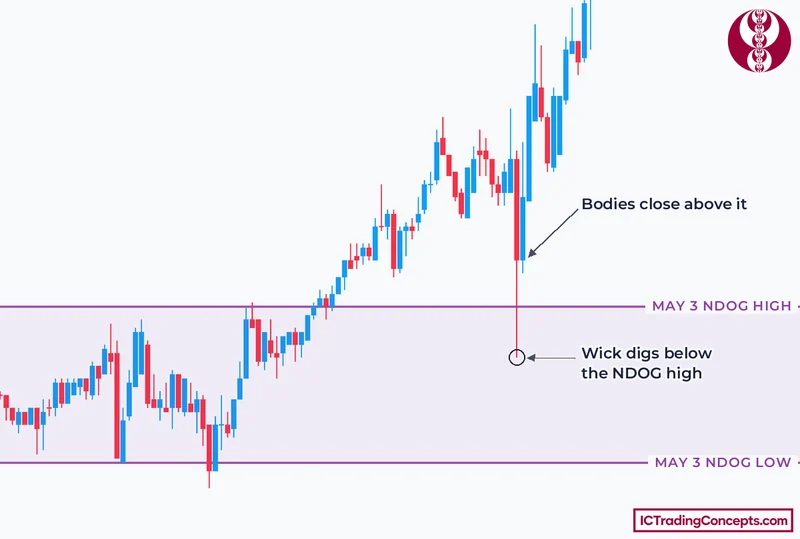
Bodies, not wicks. A wick through the level alone does not show that the NDOG has lost respect; judge the reaction by candle-body closes, for example where each 5-minute candle closes relative to the NDOG top or bottom. In ICT's example, price digs into an old NDOG high with its wicks, but the candle bodies do not close below it, and price then moves higher. As ICT puts it, "the wicks do the damage, but the body tells the story."
Agreement with other PD arrays. An NDOG that lines up with a fair value gap, an order block or an OTE level from your other analysis supports an idea you already have. A lone gap with nothing else around it gives little to work with.


NDOG vs NWOG, ORG and FVG
ICT uses several gaps that all have a top, a bottom and a CE, so they are easy to mix up. The clearest way to separate them is by the two reference prices behind each one, when it forms and how it is built.
| Gap | Reference price 1 | Reference price 2 | When it forms | Structure |
|---|---|---|---|---|
| NDOG (new day opening gap) | Last trade before the 5:00 PM halt | First trade after the 6:00 PM reopen | Monday to Thursday evenings | Two prices across a one-hour halt |
| NWOG (new week opening gap) | Last trade before the Friday 5:00 PM close | First trade after the Sunday 6:00 PM reopen | Once a week, over the weekend | Two prices across the weekend halt |
| ORG (opening range gap) | Previous regular-session close (4:15 PM) | Regular-session open (9:30 AM) | Each regular trading day | Two prices across the overnight session, seen on a regular-hours chart |
| FVG (fair value gap) | Candle 1 high (bullish) or low (bearish) | Candle 3 low (bullish) or high (bearish) | Any time, on any timeframe | Three-candle imbalance inside continuous trading |
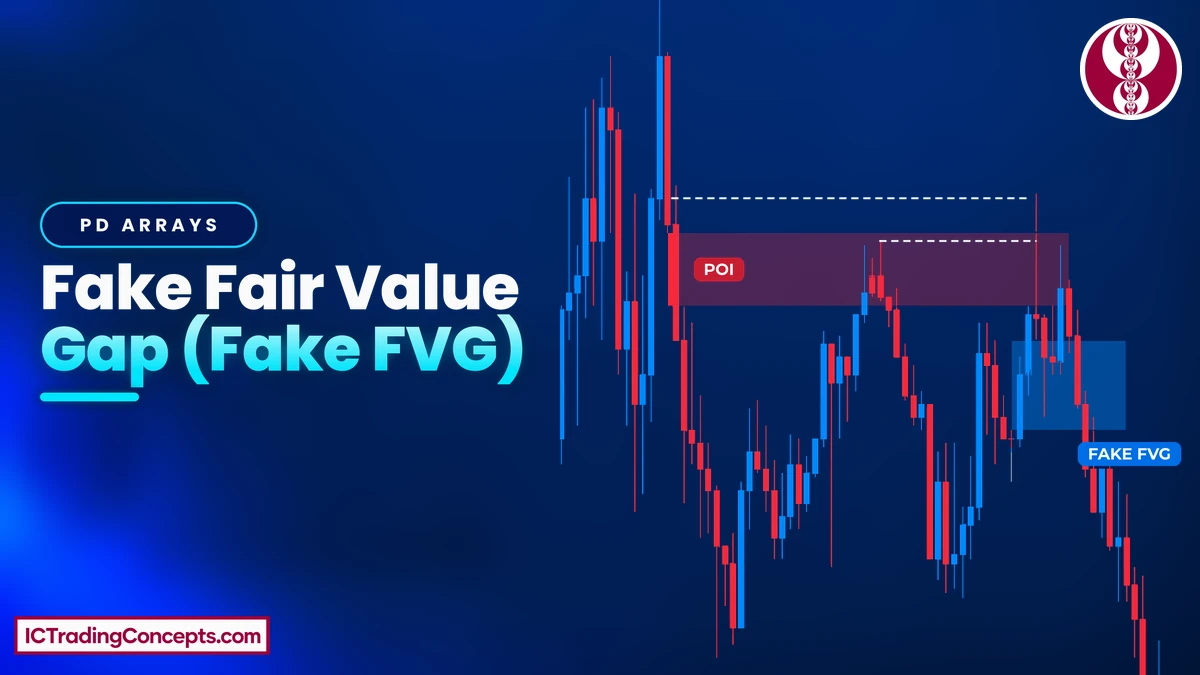
The table shows why an NDOG is not a fair value gap. An FVG comes from a fast three-candle move while the market is trading. An NDOG comes from the clock: it needs only the two prices on either side of the daily halt, whether price moved fast or not.
NDOG and NWOG share the same two-price construction, but the new week opening gap spans the weekend instead of one hour. On Monday, the Sunday open has already created the NWOG, and the first NDOG of the week forms at Monday's 5:00 PM to 6:00 PM break.
How the Gap Is Used in Practice
In practice the NDOG is a supporting factor. ICT uses it to support, or argue against, an idea he has already reached with other PD arrays and analysis, not as a reason to trade on its own. A simple order of work keeps it in that role:
- Build the bias and the trade idea first, from market structure and other PD arrays.
- Check whether an NDOG from the five-day lookback sits near the area where that idea would play out.
- If it does, use its top, bottom or CE as an extra reference for where price may react, and judge the reaction by candle bodies.
In ICT's confluence example, an old NDOG low lines up with a fair value gap and an OTE retracement. Price returns to that area, holds above it and moves higher. The NDOG did not create the trade; it confirmed the location of a setup that already existed. When several opening gaps cluster below price, ICT expects price may be drawn toward them, but he treats that as a filter, not a rule.


A simpler case is ICT's repricing scenario: when a gap down has formed and price has not yet traded back up to the top of the gap, he likes to see it trade up and reprice that top; after a gap up, the same idea applies in reverse. Treat it as a scenario to watch, not an expectation.
Common Mistakes
Most NDOG errors come from marking the wrong prices or asking too much of the level:
- Using the wrong clock. The 5:00 PM and 6:00 PM marks are New York local time. Broker server time or your local time zone produces a different gap.
- Marking an NDOG on Friday. No NDOG forms on Friday evening. The Friday close to Sunday open gap is the NWOG.
- Reading a regular-hours chart. Without the overnight session the chart shows a different gap, not the NDOG.
- Giving a one or two tick gap the same weight as a clear gap. ICT filters these out of use.
- Treating a wick through the gap as failure. Judge respect by candle bodies, not wick extremes.
- Trading the NDOG on its own. It supports an idea built from other PD arrays; it is not a standalone signal.
- Reading bullish or bearish as a trade direction. The label only describes how the gap formed.
New Day Opening Gap Indicators
Marking NDOGs by hand is quick, but a new day opening gap indicator can draw the top, bottom and CE automatically after every 6:00 PM reopen. These three TradingView indicators plot the gap for you.
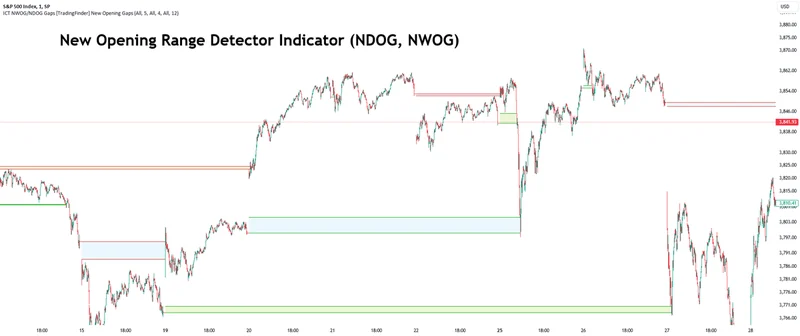
ICT NWOG/NDOG Gaps [TradingFinder]
Plots new day and new week opening gaps as boxes, so recent NDOGs and the current NWOG appear on the same chart.
View on TradingView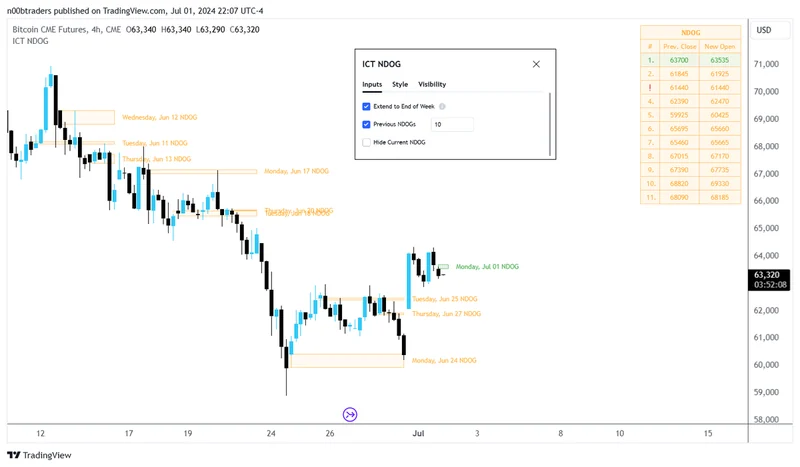
ICT New Day Opening Gap (n00btraders)
Draws the 5:00 PM to 6:00 PM gap on index futures with its top, bottom and CE, and labels each gap with the trading day it belongs to.
View on TradingView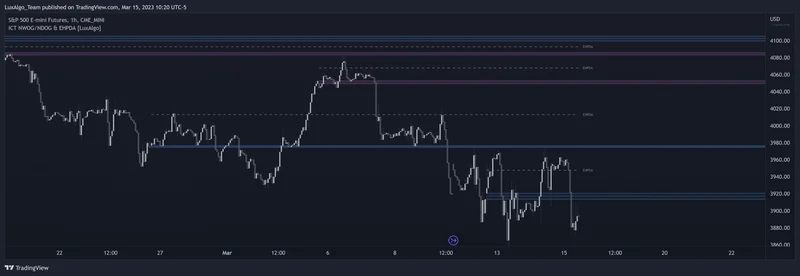
ICT NWOG/NDOG & EHPDA [LuxAlgo]
Displays recent NDOGs or NWOGs, plus the EHPDA levels between neighbouring gaps; those levels are not the CE of a single NDOG.
View on TradingViewTest Your New Day Opening Gap (NDOG) Knowledge
Eight quick questions on the two NDOG prices, the Monday to Thursday rule, marking the top, bottom and CE, the five-day lookback, bodies versus wicks and how the gap differs from an FVG. Each answer links back to the section that explains it.
ABCD Answer with your keyboard
-
01Which two prices make a New Day Opening Gap (NDOG)?
An NDOG uses two prices in New York local time: the last trade before 5:00 PM and the first trade after the 6:00 PM reopen. Review: What Does New Day Opening Gap (NDOG) Mean in ICT?
-
02On which evenings does an NDOG form?
CME pauses index futures from 5:00 PM to 6:00 PM ET Monday through Thursday. Friday's close to Sunday's open is a new week opening gap (NWOG), not an NDOG. Review: How Does the New Day Opening Gap Form?
-
03In a bullish NDOG (gap up), which price is the bottom of the gap?
A bullish NDOG forms when the 6:00 PM open prints above the last trade before 5:00 PM, so the 5:00 PM price is the bottom and the 6:00 PM price is the top. Review: this section
-
04How do you find the NDOG consequent encroachment (CE)?
The CE is the price exactly halfway between the top and the bottom. A Fibonacci tool set to 0, 0.5 and 1 marks it in one step. Review: this section
-
05How far back does this guide track NDOGs?
The guide keeps the NDOGs from the last five days in view, the starting rule ICT describes. The five-week lookback belongs to new week opening gaps. Review: this section
-
06Price wicks through an old NDOG high, but candle bodies keep closing above it. How should that be read?
A wick through the level alone does not show that the NDOG has lost respect. Judge the reaction by where the candle bodies close relative to the top or bottom. Review: What Separates a Strong Gap From a Weak One?
-
07Why is an NDOG not a fair value gap?
An FVG comes from a fast three-candle move while the market is trading. An NDOG needs only the two prices on either side of the daily halt, whether price moved fast or not. Review: NDOG vs NWOG, ORG and FVG
-
08How does ICT use the NDOG in practice?
The NDOG supports, or argues against, an idea reached with other PD arrays. In ICT's confluence example it confirmed the location of a setup that already existed. Review: How the Gap Is Used in Practice
Review your answers
Conclusion
The new day opening gap is a clock-based reference: the last trade before the 5:00 PM New York halt and the first trade after the 6:00 PM reopen, Monday to Thursday. Mark the higher price as the top, the lower as the bottom and the midpoint as the CE, keep recent gaps within the five-day lookback, and skip gaps of only a tick or two. Read every reaction by candle bodies, and use the NDOG to support an idea you already have, not to create one.
Sources
- E-mini Nasdaq-100 futures contract specs: CME Group
- NDOG, New Day Opening Gap, Part 1: ICT, YouTube
- Identifying directional bias using the New Day Opening Gap: ICT Gems, YouTube
Be the first to share your thoughts on this article.