

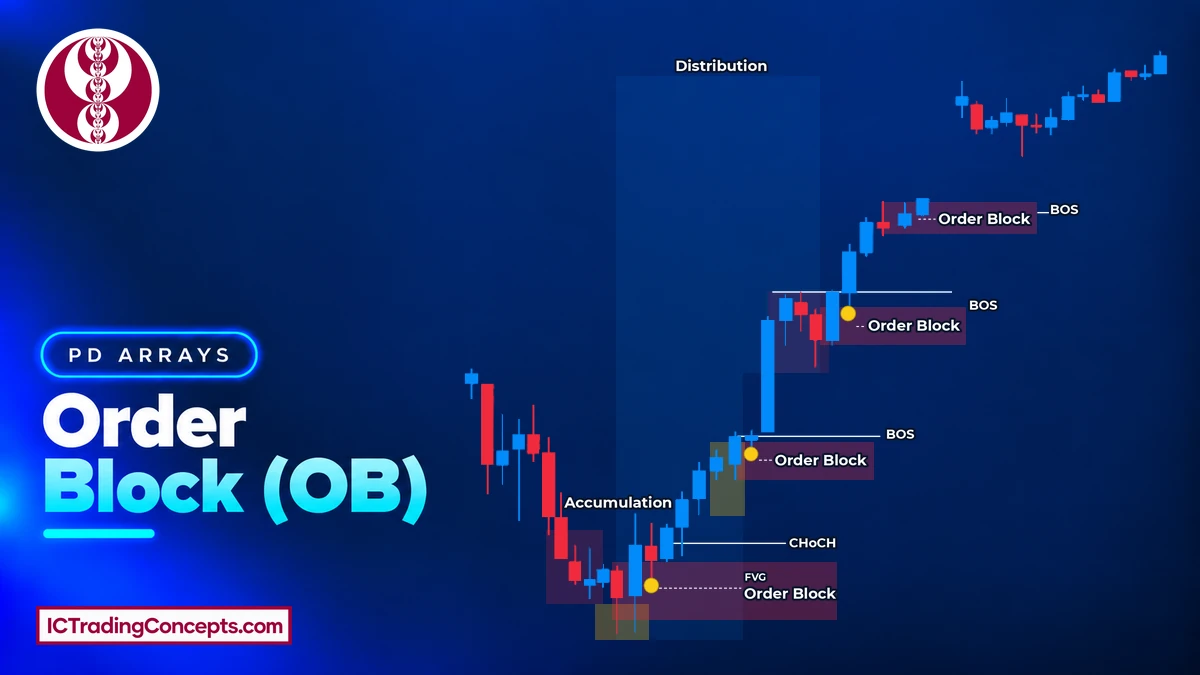
An order block (OB) is the last opposite candle before a strong move that breaks market structure. A bullish OB is the last down-close candle before a rally that breaks a swing high. A bearish OB is the last up-close candle before a drop that breaks a swing low. Traders mark that candle from its high to its low and watch for a reaction when price returns to it for the first time.
Key Takeaways
- An order block needs three parts: the last opposite candle, a displacement away from it and the structure break that the move creates, either a BOS with the trend or a market structure shift (MSS) against it.
- The zone runs from the candle's high to its low, wick included. The open marks the edge of the candle body.
- Three signs make an OB stronger: its candle sweeps the previous candle's low or high, a fair value gap forms right after it, and the zone is still fresh.
- Higher-timeframe order blocks set the area to watch. Lower-timeframe charts time the entry inside it.
- When price runs liquidity and then closes through an order block, the failed zone can turn into a breaker block.
What Is an Order Block in Trading?
An order block is a price zone where large buy or sell orders are believed to have been placed just before an impulsive move. The zone is the candle that printed right before that move started. Price later tends to treat it as support or resistance, because unfilled orders in that area can trigger a reaction.
A bullish OB works as a demand area below price. A bearish OB works as a supply area above price. In both cases, the block only counts after the move away from it breaks a swing point. Without that structure break, the candle is just the last down-close or up-close candle on the chart.
Which Candle Forms an Order Block?
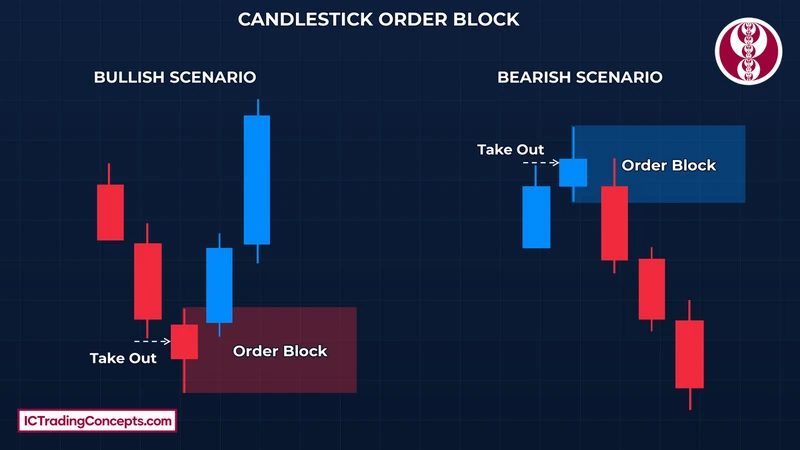
A bullish OB comes from the last bearish candle before a strong bullish move. A bearish OB comes from the last bullish candle before a strong bearish move. That candle is the final opposite candle before price changes pace and direction.
Not every last opposite candle qualifies. The move after it must be impulsive, and it must break structure. When two or three small same-colour candles sit together at the origin of the move, they can be treated as one block. In that case, the zone covers the full range of the cluster.
Is the Order Block an ICT or SMC Concept?
The order block is used in both ICT and Smart Money Concepts (SMC). In ICT, Michael J. Huddleston teaches it as one of the PD arrays, the reference zones used to frame entries. His material is on ICT's official site. ICT traders read it together with market structure shifts, liquidity sweeps and fair value gaps.


SMC traders use the same candle as a point of interest (POI). They mark it after a break of structure (BOS) or a change of character (CHoCH) and wait for price to come back to it. The candle, the zone and the logic are the same in both schools.
How Does an Order Block Form?
An order block forms in a short sequence. Price moves in one direction and prints a final opposite candle. Then a displacement leg starts in the other direction. That leg breaks a recent swing high or swing low, and it often leaves a fair value gap behind. The candle at the origin of the leg is the OB.
Why Do Order Blocks Form?
Large institutions cannot fill a big order at one price. Buying or selling the full size at once would move the price against them, an effect known as market impact. So they build the position step by step across a narrow price range. When enough of the order is filled, price leaves that range with force, and the range becomes the order block.
While the block forms, price often runs the stops resting beyond nearby highs or lows, such as equal lows below a bullish block. Those stop orders give large buyers or sellers the opposite side they need. When price returns to the zone later, the unfilled part of the position can make price react. This is the reasoning behind the concept. It explains why the zone matters, but it does not guarantee a reaction.
Bullish Order Block
A bullish order block is the last down-close candle before an upward displacement that breaks above a recent swing high. In an uptrend, that break is a bullish BOS. After a downtrend, it is a bullish MSS. When price pulls back from above, traders watch the block as demand and expect support.


A strong bullish block often shows two extra clues. The order block candle trades below the low of the candle before it. The candles after it leave a bullish fair value gap above the block.
Bearish Order Block
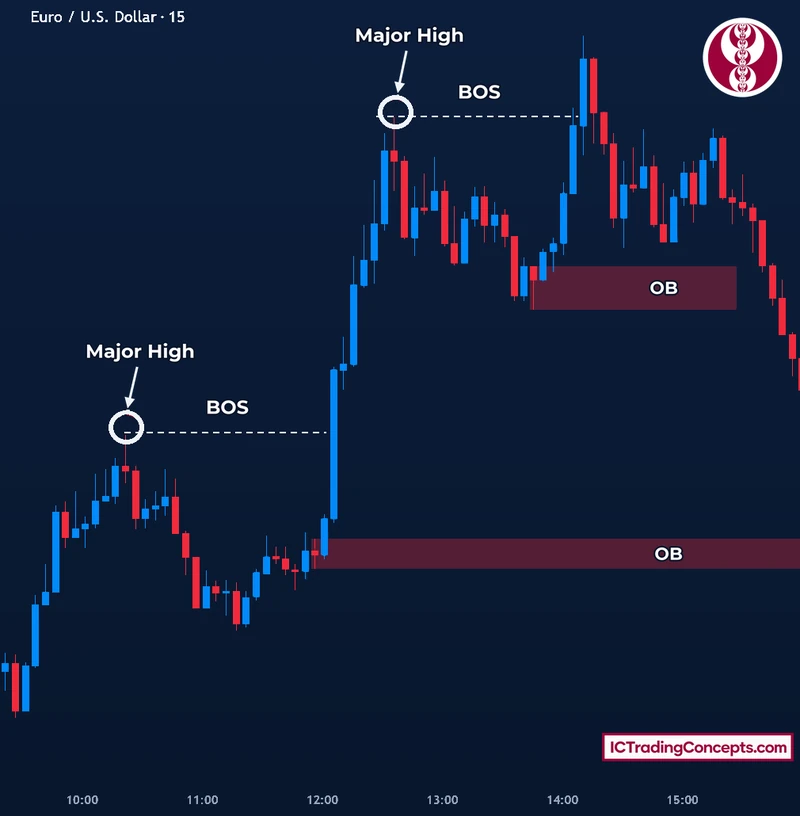
A bearish order block is the last up-close candle before a downward displacement that breaks below a recent swing low. In a downtrend, that break is a bearish BOS. After an uptrend, it is a bearish MSS. When price rallies back from below, traders watch the block as supply and expect resistance.
The same two clues apply in reverse. The order block candle trades above the high of the candle before it. The drop that follows leaves a bearish fair value gap below the block.
How to Identify an Order Block
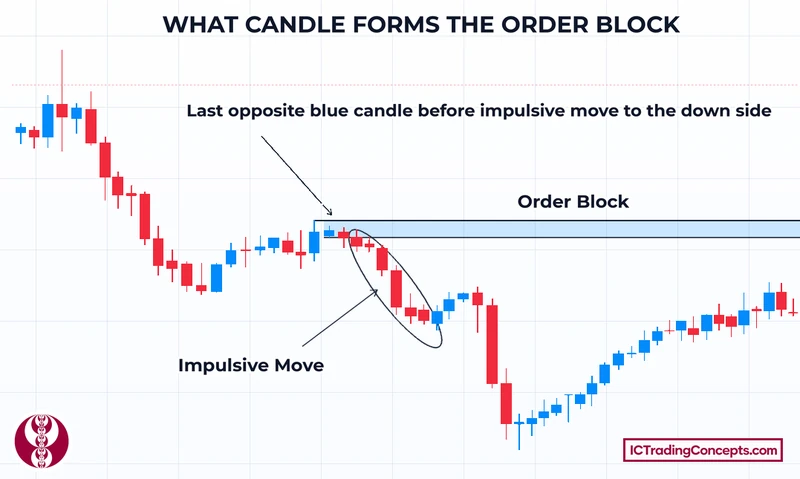
Identification starts from the move, not from the candle. You first find a leg that proves the market changed pace, then you trace it back to where it began.
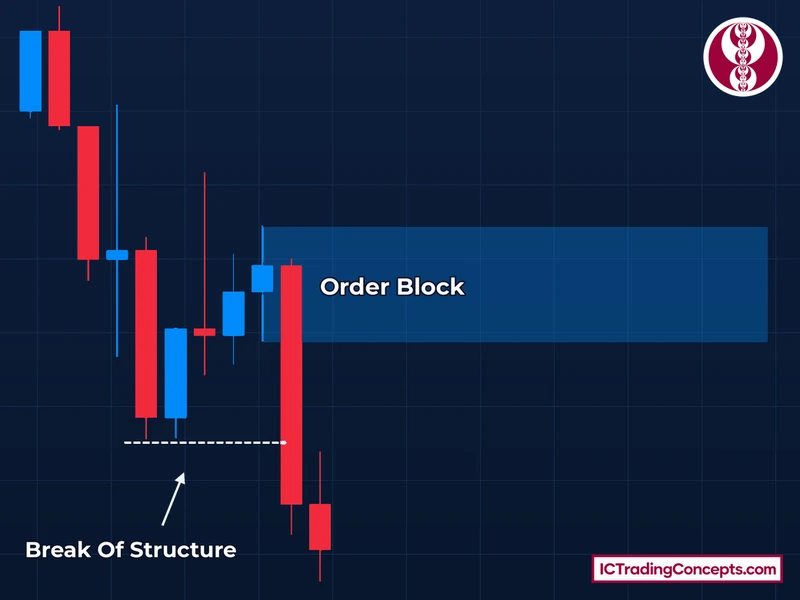
- Find the structure break. A bullish leg closes above a recent swing high. A bearish leg closes below a recent swing low. This is a BOS in the trend's direction or an MSS against it.
- Check the displacement. The leg should be made of large-bodied candles that leave the area quickly. A slow, overlapping drift does not count.
- Trace the leg back to its origin. Take the last down-close candle before a rally or the last up-close candle before a drop.
- Note whether the zone is still fresh. Price should not have traded back into the candle's range since the move left it. A fresh zone makes the block stronger, but freshness is not part of the definition.
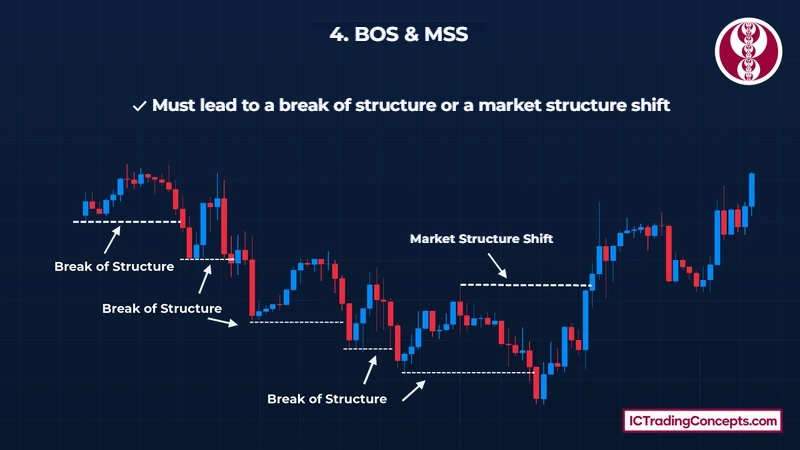
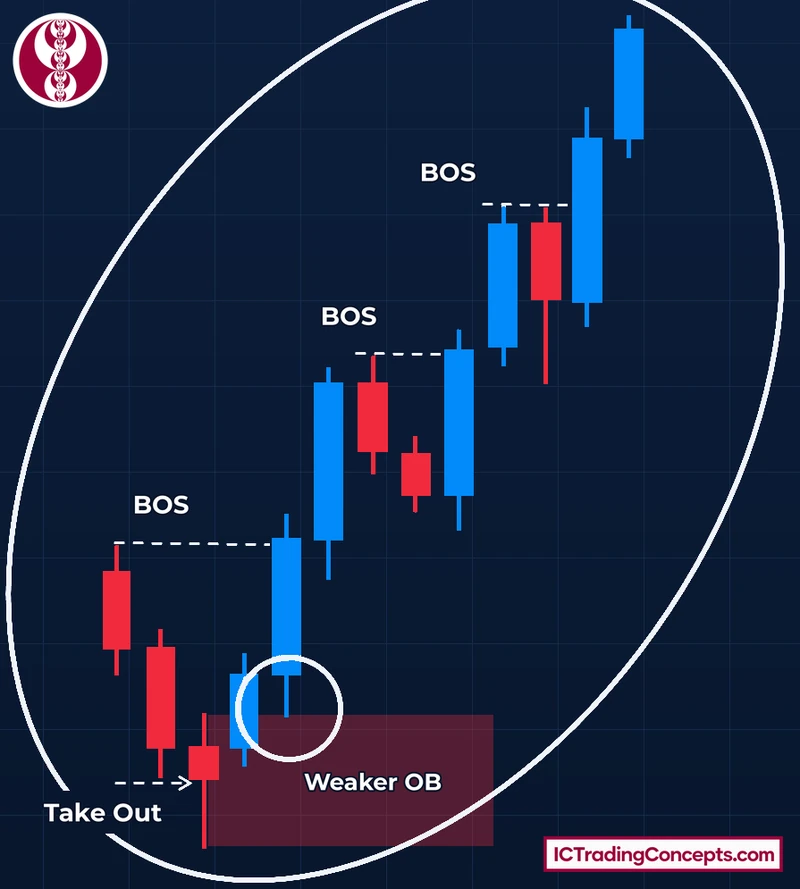
The chart below shows why the structure break matters. Each break of structure, and the market structure shift that ends the downtrend, is a leg you can trace back to its first candle.
How to Mark an Order Block Zone
Draw the order block from the candle's high to its low, with the wick included. The wick belongs to the zone because price traded there while the orders were placed. Extend the box to the right until price returns to it.
- Bullish order block: the top of the zone is the candle's high. The open sits at the top of the body. The bottom of the zone is the candle's low.
- Bearish order block: the bottom of the zone is the candle's low. The open sits at the bottom of the body. The top of the zone is the candle's high.
- Cluster of candles: use the highest high and the lowest low of the whole cluster.
Two lines inside the box are useful later. The open is the body edge that price meets right after the wick. The 50% level of the zone sits halfway between the high and the low. Both are common entry lines, as the entry section shows.
What Makes an Order Block Strong or Weak?
A valid order block can still be weak. Strength comes from how cleanly the block formed and how price left it. A strong block leads to a clear impulsive move, breaks an obvious swing and gets a quick reaction when price returns. A long wick at the origin is a further sign of heavy participation. Alignment with the higher-timeframe direction matters as well, because blocks traded against the bias fail more often.

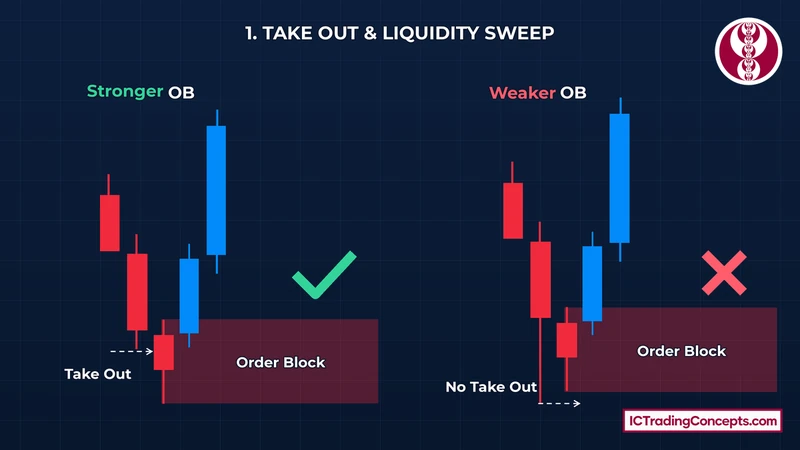
Three signs from the candles themselves help most when you compare two blocks.
The Order Block Candle Takes the Previous Low or High
In a bullish OB, the block's candle trades below the low of the candle before it. That small sweep clears the stops resting under that low before the rally starts. In a bearish OB, the block's candle trades above the high of the candle before it.
A block with this sweep shows that liquidity was taken first. A block without it can still be valid, but it shows less evidence of large orders at that price.
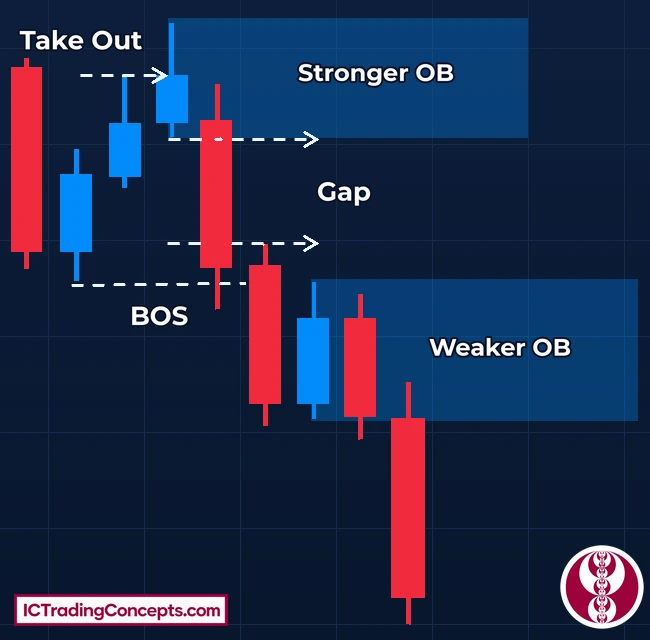
The same comparison works for bearish blocks. The stronger bearish block runs the previous candle's high before the drop, while the weaker one turns lower without taking it.
A Fair Value Gap Right After the Order Block
Check the three candles that start with the OB. In a bullish block, compare the high of the OB candle with the low of the third candle. If those two wicks do not overlap, the middle candle left a fair value gap (FVG). In a bearish block, compare the low of the OB candle with the high of the third candle.
The gap is the footprint of displacement. Price moved so fast that it left one side of the market unfilled. An order block without a gap after it is usually weaker, because the move away from it was slower.
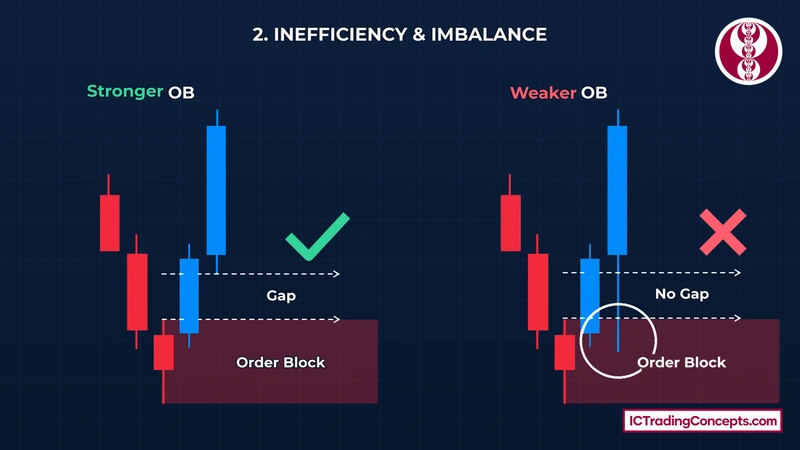
On the bearish side, the gap sits below the block. If the third candle's high reaches back into the order block candle's low, there is no gap and the block is weaker. In the example below, the drop from the block also breaks the swing low, so the same leg gives the BOS and the gap.


When a gap forms, it sits next to the block, closer to price. On the return, price often reacts at the gap first. If the gap does not hold, the block below it (bullish) or above it (bearish) is the deeper line. When the gap sits right on top of the block, the area gives two reasons for price to react at the same place.
Fresh vs Mitigated Order Blocks
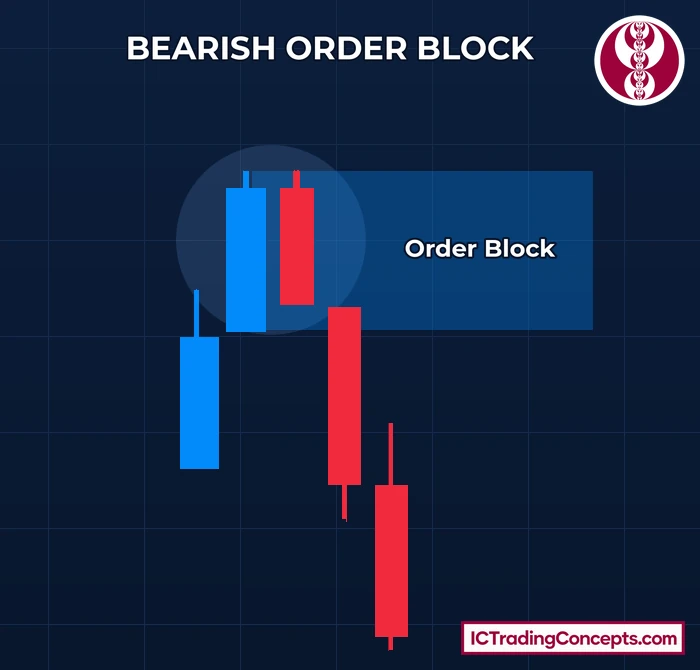
An order block is mitigated once price trades back into its zone after the move has left it. Even a wick counts. The candle right after the block starts at the zone, so it does not count. If the third candle already trades back into the block while the move is forming, the block is mitigated from the start.
A fresh block, one that price has not returned to yet, gives the cleaner first reaction. Each later visit uses up more of the orders resting there, so a block that has already been tested is weaker. That is why mitigated blocks are often skipped in favour of the next fresh one.
A bearish block follows the same rule. In the example below, the third candle still trades inside the zone, so the block is mitigated from the start.


Order Blocks Across Timeframes and Markets
The way you read an order block does not change with the chart. What changes is how much weight the block carries and which role it plays in a trade.
Are Higher-Timeframe Order Blocks Stronger?
Higher-timeframe order blocks are generally more reliable. Blocks on the 4-hour, daily and weekly charts filter out noise and reflect larger positions. They often lead to major structure breaks, and they tend to draw a clearer reaction when price returns to them.
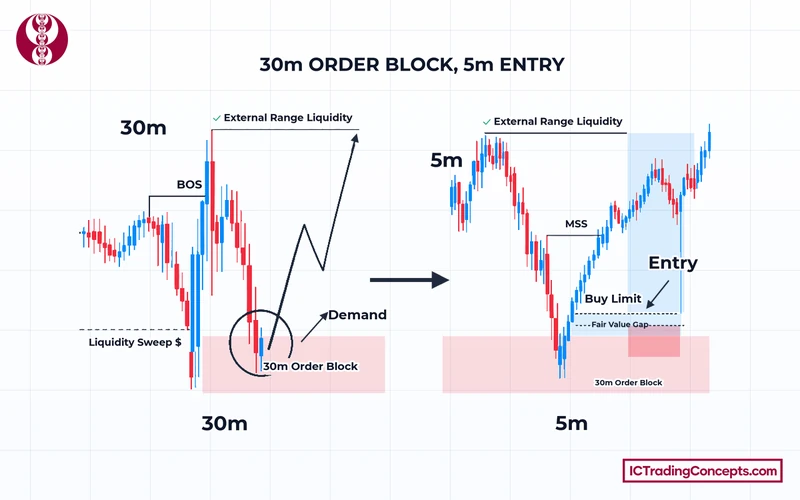
Lower-timeframe blocks on the 15-minute or 5-minute chart are better for timing. A common approach uses both. The higher timeframe defines the zone, and the lower timeframe times the entry. In the example below, the 30-minute bullish order block is complete on its own, with the structure break and all three strength signs. Its candle sweeps the liquidity below the previous low. The rally from it leaves a gap and breaks structure with a BOS. The zone is still fresh when price comes back. On that return, the 5-minute chart shows a market structure shift and a fair value gap. They do not create the block. They only refine the entry inside it.
Which Markets Do Order Blocks Work In?
Order blocks work on any market and timeframe that is read with candlestick price action. Common examples are major forex pairs such as EUR/USD and GBP/USD, gold (XAU/USD), and index futures such as the E-mini S&P 500 and E-mini Nasdaq-100. Stocks and crypto charts use the same reading.
What matters more than the market is the condition of the chart. Order blocks are clearer during strong, directional sessions. They fail more often in choppy or low-volume conditions, where displacement is rare.
Reversal and Continuation Order Blocks
The same candle pattern can mark a turning point or a pause inside a trend. The structure break that the move creates tells you which one you are looking at.
Reversal Order Block
A reversal order block forms near a market top or bottom. The move away from it breaks structure against the old trend, which is a market structure shift. At a top, the bearish block marks where large players switched from buying to selling. At a bottom, the bullish block marks the switch from selling to buying. A reversal block trades against the old trend, so it is safer to use once the higher-timeframe bias has turned.
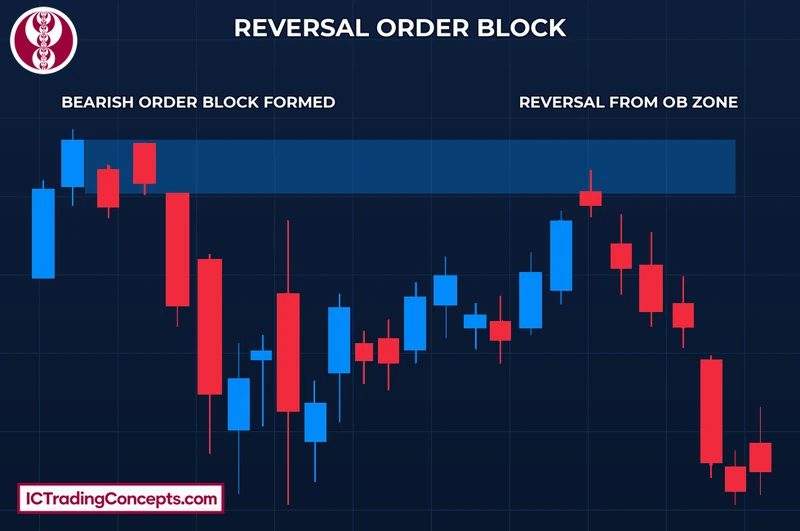
The bullish side appears in the bullish entry example further down: that order block forms at a low, and the rally from it breaks structure with a bullish MSS.
Continuation Order Block
A continuation order block forms inside an existing trend, after a pullback. The next leg breaks a swing in the trend's direction, a break of structure (BOS). In an uptrend, it marks re-accumulation before the next push higher. In a downtrend, it marks re-distribution before the next leg down. Traders use these blocks to join or add to a trend that is already running. The EUR/USD chart in the bullish section shows two of them: each pullback ends with a last down-close candle, and the next rally breaks the major high.
Order Block vs Commonly Confused Zones
Order blocks are often confused with nearby concepts that are drawn in a similar place. The table shows how each one is defined and what it is expected to do.
| Concept | What it is | How it is drawn | Expected role on return |
|---|---|---|---|
| Order block | Last opposite candle before displacement that breaks structure | Candle high to low, wick included | Price reacts and continues in the direction of the displacement |
| Supply or demand zone | Base area inside a price-action pattern such as rally-base-drop | Wider area around the base, often several candles | Price reacts from the base area |
| Fair value gap | Three-candle imbalance left by displacement | From candle 1's wick to candle 3's wick | Price returns to fill part or all of the gap |
| Breaker block | Order block that failed after a liquidity run | The old order block zone | Price reacts in the opposite direction to the old block |
How Is an Order Block Different From a Supply or Demand Zone?
An order block points to one candle, or a tight cluster of candles, right before an impulsive move. That move must break structure, and it often leaves a fair value gap. A supply or demand zone is a broader area. It is built from price-action patterns such as rally-base-drop or drop-base-rally, and it does not need a structure break. In short, every order block sits in demand or supply, but not every supply or demand zone is an order block.
Breaker Block: When an Order Block Fails
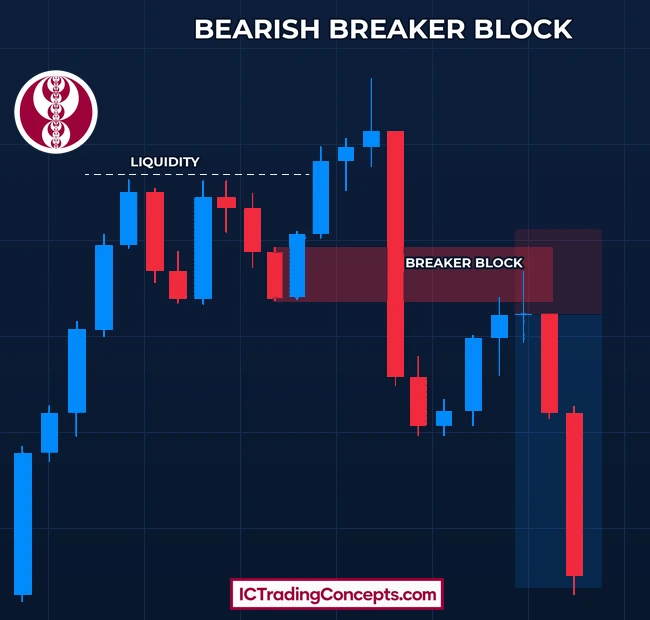
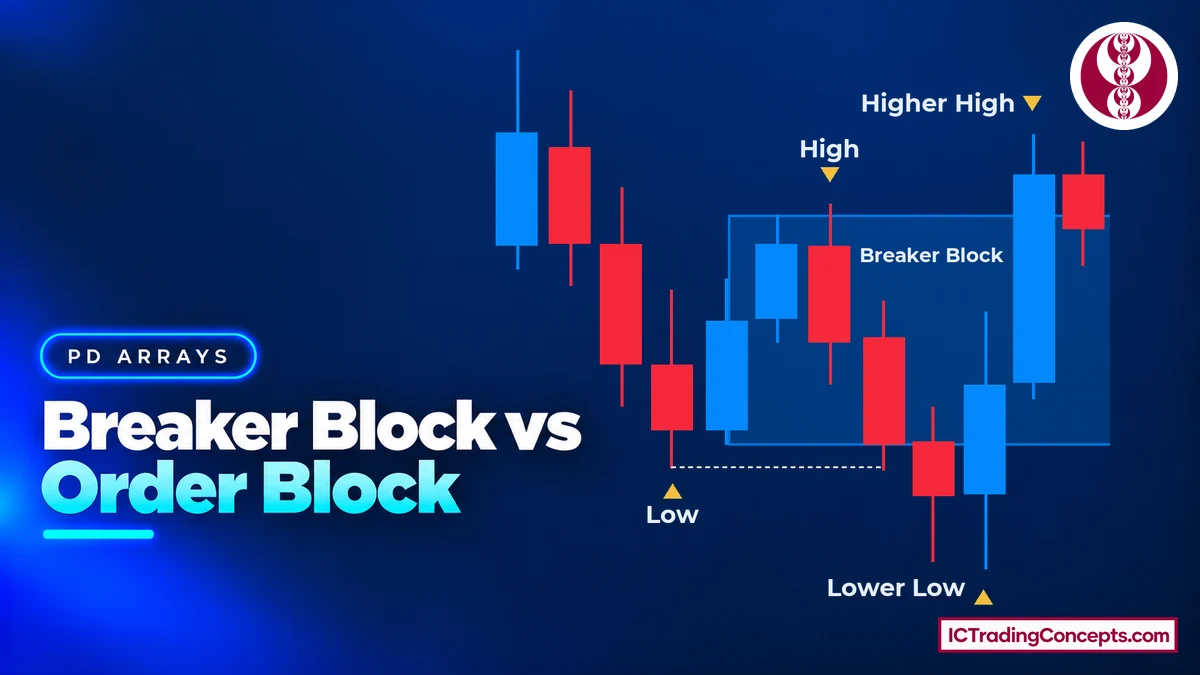
An order block fails when price closes through it instead of reacting. In ICT's breaker block, price first runs the liquidity beyond a swing, and then a candle body closes through the old order block. The failed zone then works in the opposite direction. A failed bullish OB becomes a bearish breaker, and a failed bearish OB becomes a bullish breaker. The level is the same, but the trade idea is reversed.
How Order Blocks Are Used in Practice
Using an order block is a matter of waiting for price to come back to a marked zone in the right context. Five steps take the trade from the higher-timeframe bias to the entry and the stop.
- Set the direction. Read the higher-timeframe bias and look only for buys at bullish blocks or sells at bearish blocks in that direction.
- Mark the block. Mark a valid order block on the higher timeframe you trade from, such as the 30-minute, 1-hour or 4-hour chart.
- Wait for the return. Let price come back to the zone. Do not chase the impulsive move.
- Confirm the reaction. Watch for rejection from the zone or a structure shift on a lower timeframe. At a bearish order block, for example, price rallies back into the zone and is rejected hard. The entry comes after that rejection, with the stop above the block.
- Place the trade. Put the stop beyond the far side of the block with a small buffer. Target the next liquidity, such as a previous high or low or equal highs or lows. A common minimum is a reward twice the size of the risk.
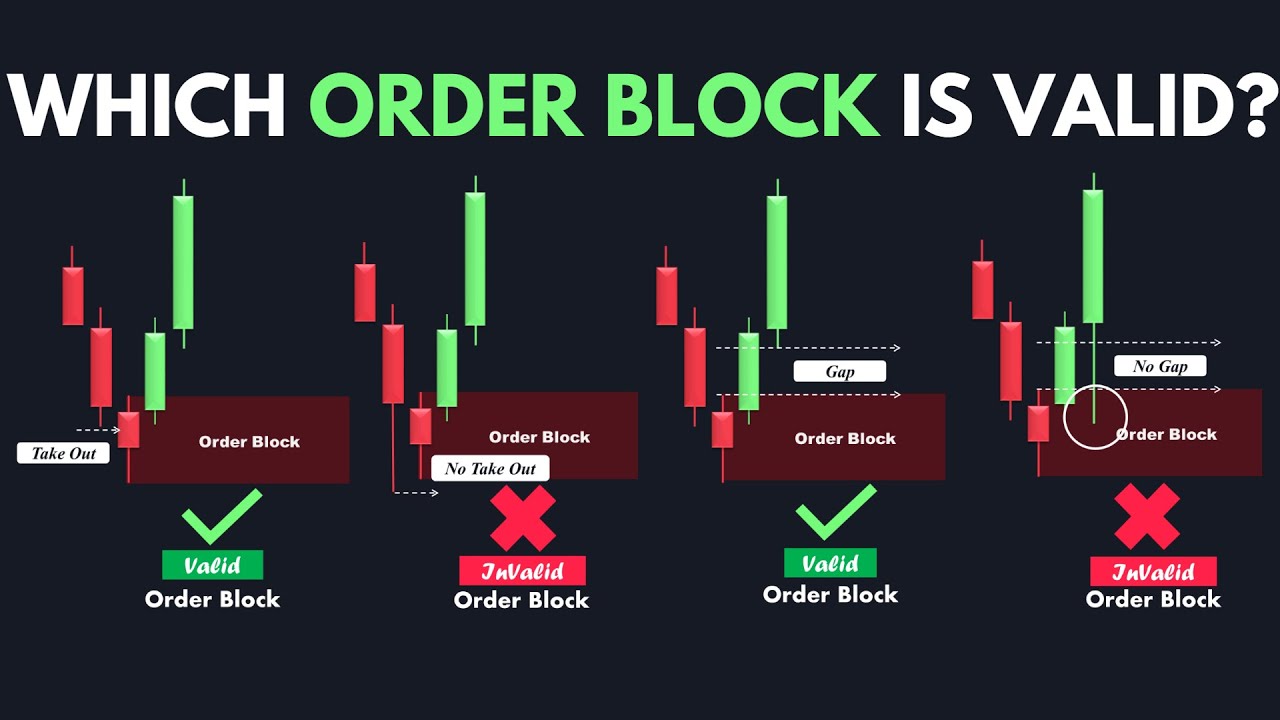
The video below walks through a strict checklist for high-quality order blocks. It checks for a sweep of the previous candle, a gap after the block, an unmitigated zone and a BOS or MSS. It also shows four ways to enter inside the zone.
Entry Options Inside the Zone
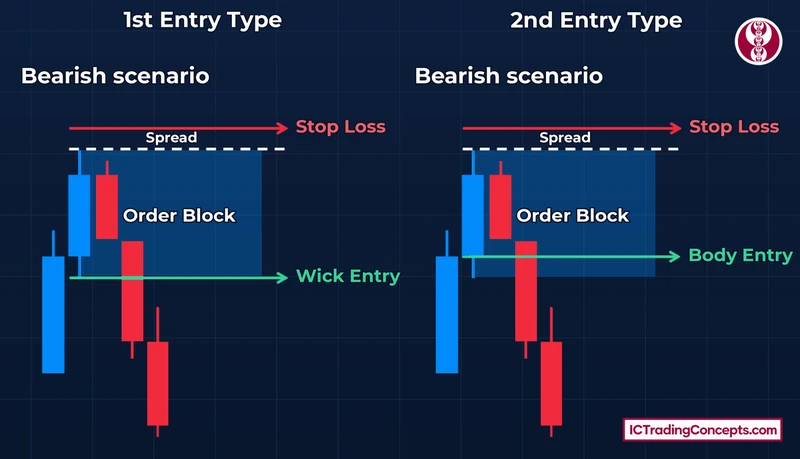
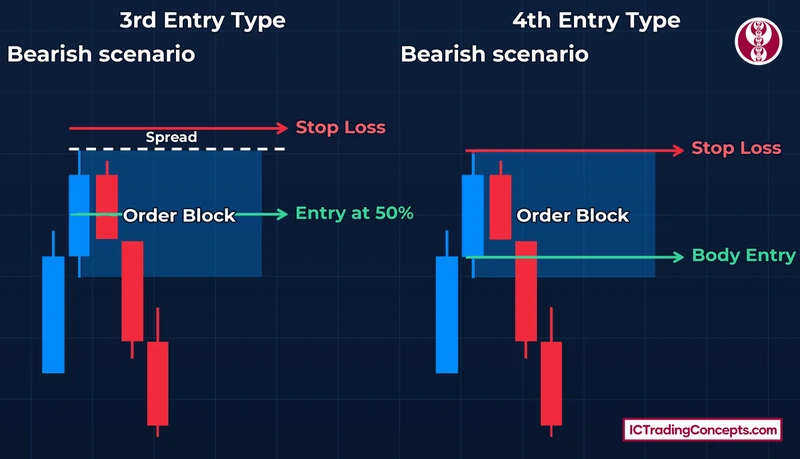
There are four common ways to enter at an order block. Each one is usually placed as a limit order, so the trade fills only if price reaches the chosen line. A limit order is the no-confirmation option: it fills before price shows any reaction. The examples below describe a bearish block; for a bullish block, reverse the directions.
| Entry | Where the order sits | Stop loss | Trade-off |
|---|---|---|---|
| Wick entry | At the near wick of the order block | A spread beyond the far wick | Fills most often, but the stop is widest |
| Body entry | At the open, the edge of the body | A spread beyond the far wick | Better reward to risk, but price may only touch the wick and leave |
| 50% entry | At the midpoint of the zone | A spread beyond the far wick | Tighter stop and higher reward to risk, but fills less often |
| Body entry, tight stop | At the open | Exactly at the far wick, no buffer | Tighter stop than the body entry, but the highest chance of being stopped out |
The buffer is about the size of the bid-ask spread. It keeps the stop from being hit by a wick that only touches the block's extreme.
The third and fourth types trade fills for a smaller stop. One waits at the 50% level of the zone. The other keeps the body entry but sets the stop exactly at the far wick, with no spread.
Bullish Entry Example
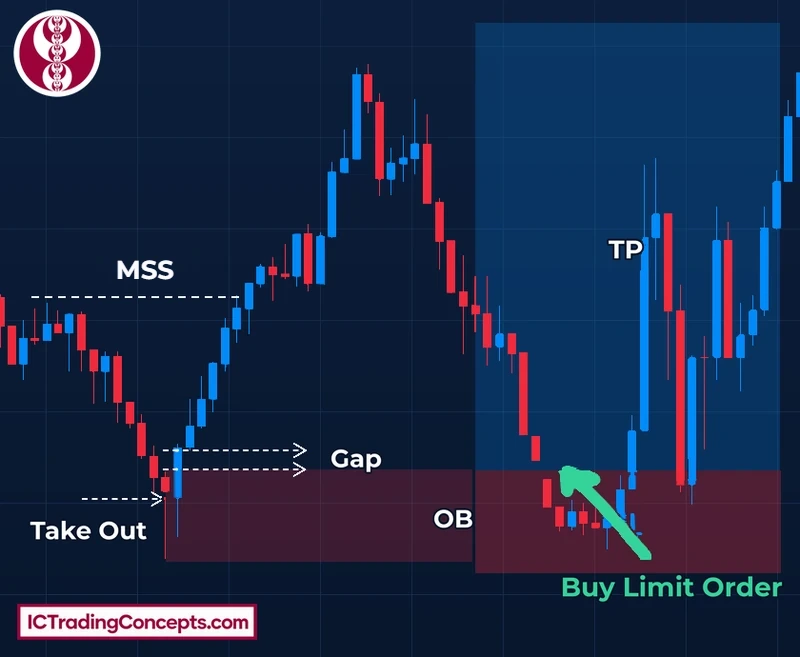
This EUR/USD 15-minute chart shows the full sequence on the bullish side. After a pullback, price breaks back above an internal high with a bullish market structure shift. The last bearish candle at the low of that move took out the previous candle's low, and the rally above it left a gap. That candle is the order block. A buy limit order sits in the block, with the stop below its low. The take-profit zone is marked above the recent highs.
Bearish Entry Example
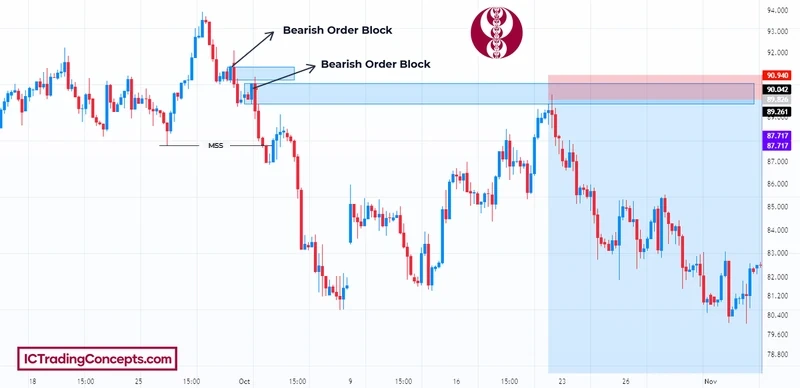
The bearish case starts after a rally runs out. Price drops and breaks below a recent swing low, a bearish market structure shift (MSS). The last up-close candle before that drop is the bearish order block. A smaller block sits just above it, left by the first leg down. The sell comes when price rallies back and retests the block. The stop sits above the block's high with a small buffer. The target is the sell-side liquidity below, such as the previous swing lows.
How Reliable Are Order Blocks?
No order block works every time. Its reliability rests on three things: a clear structure break behind it, a confirmed reaction on the return and agreement with the higher-timeframe direction. A block traded without a structure break or context is much less dependable.
| Strengths | Limits |
|---|---|
| One candle, traced back from a BOS or MSS, gives a fixed starting point | Without the structure break, the last opposite candle is only a candle |
| The sweep, the gap and a fresh zone let you rank two blocks side by side | A mitigated block has lost its first reaction, so many marked blocks drop out |
| The box gives four exact lines: high, open, 50% level and low | A limit order at those lines fills before price shows any reaction |
| The stop has a natural place beyond the far wick | The 50% and tight-stop entries cut risk but miss more trades |
| A higher-timeframe block pairs with a lower-timeframe MSS and FVG for timing | A body close through the block turns it into a breaker, against the first idea |
Common Mistakes
Most order block errors start in one of two places: the candle is marked before the structure break proves it, or the entry is taken before price returns to the zone.
- Treating any opposite candle as an order block. Without displacement and a structure break, the last down-close or up-close candle is just a candle. Mark the block only after the BOS or MSS prints.
- Trading against the higher-timeframe bias. Blocks that go against the larger direction fail more often. Filter every setup through the higher-timeframe trend first.
- Leaving no buffer beyond the block by default. Price often pokes just past the high or low on the retest. Keep a small buffer beyond the far wick, unless you choose the tight-stop entry and accept more stop-outs.
- Chasing the impulsive move. The entry is on the return to the block, not in the middle of the displacement that created it.
- Trading a mitigated block as if it were fresh. Once price has already traded into the zone, the first-reaction advantage is gone.
- Confusing an order block with a breaker block. An OB is expected to hold. A breaker is a block that already failed, and it trades in the opposite direction. Check whether a candle body has already closed through the zone before you trade it.
Order Block Indicators
An order block indicator can mark candidate zones automatically, which saves time when scanning several charts. It does not replace checking the structure break and the strength signs yourself.
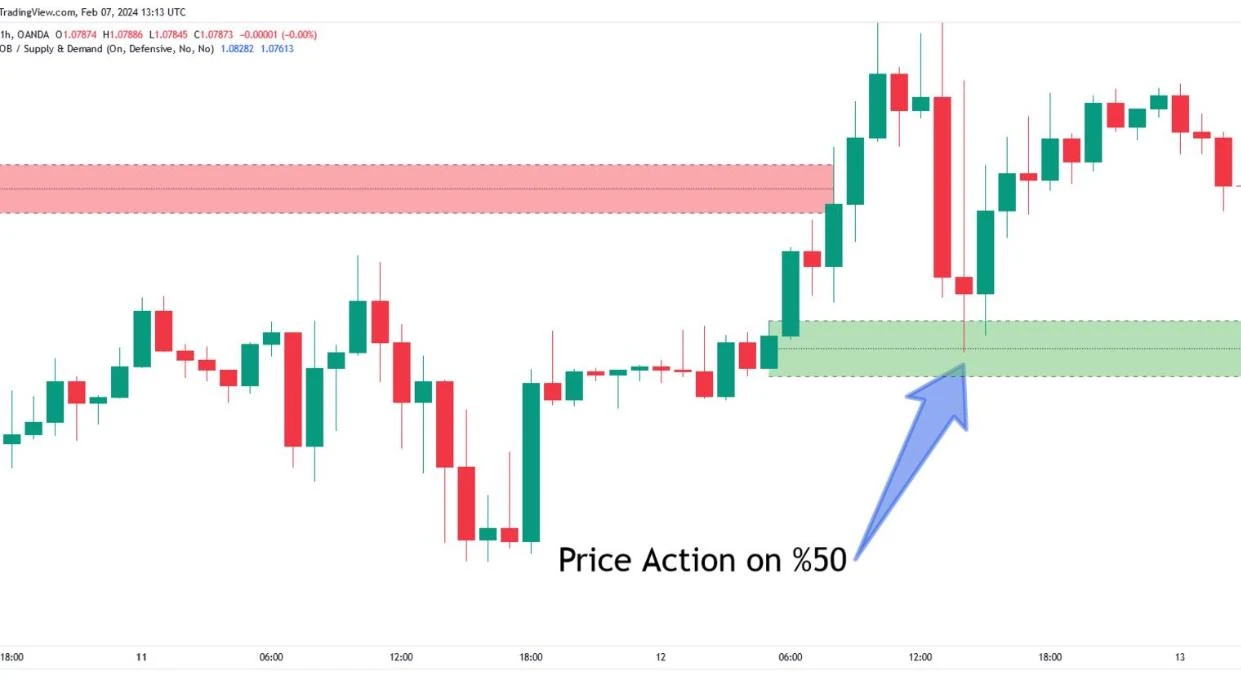
Order Blocks Finder [TradingFinder] Major OB | Supply and Demand
Marks bullish and bearish order blocks after a BOS, CHoCH or MSS. It draws each one as a box from low to high and keeps it until price reaches it.
View on TradingView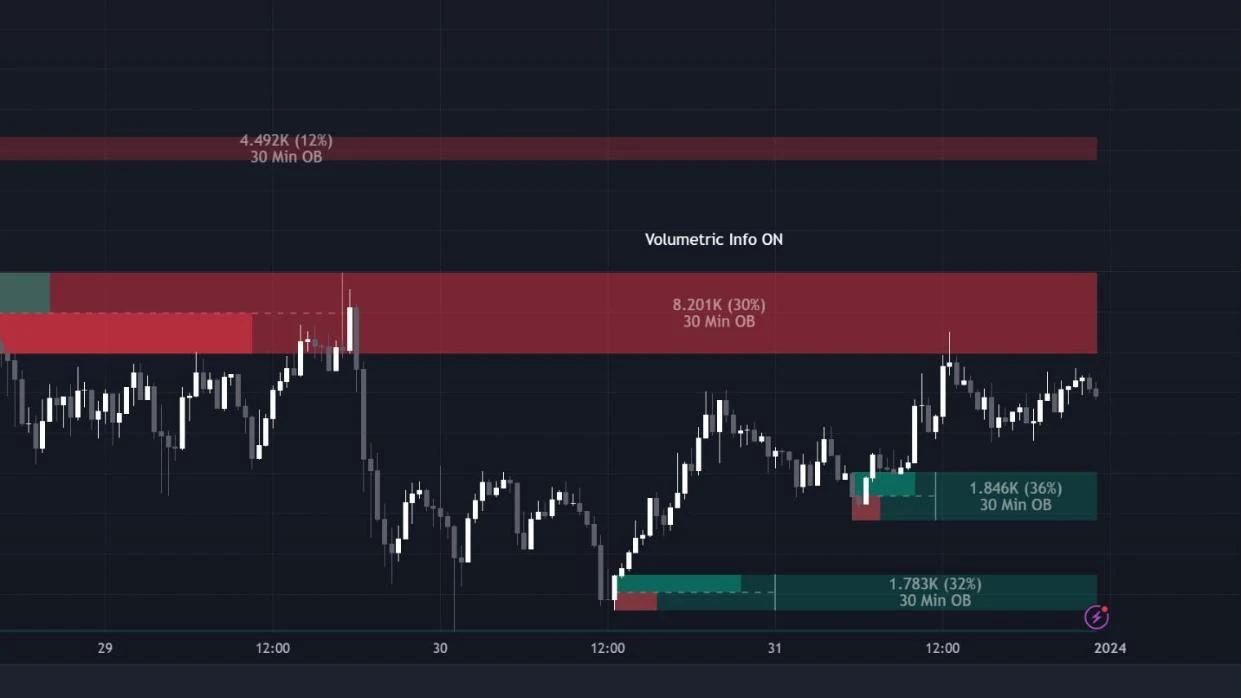
Order Blocks | Flux Charts
Finds bullish and bearish blocks from swing formations and can show the volume inside each zone. It removes a block once price invalidates it by wick or by close.
View on TradingView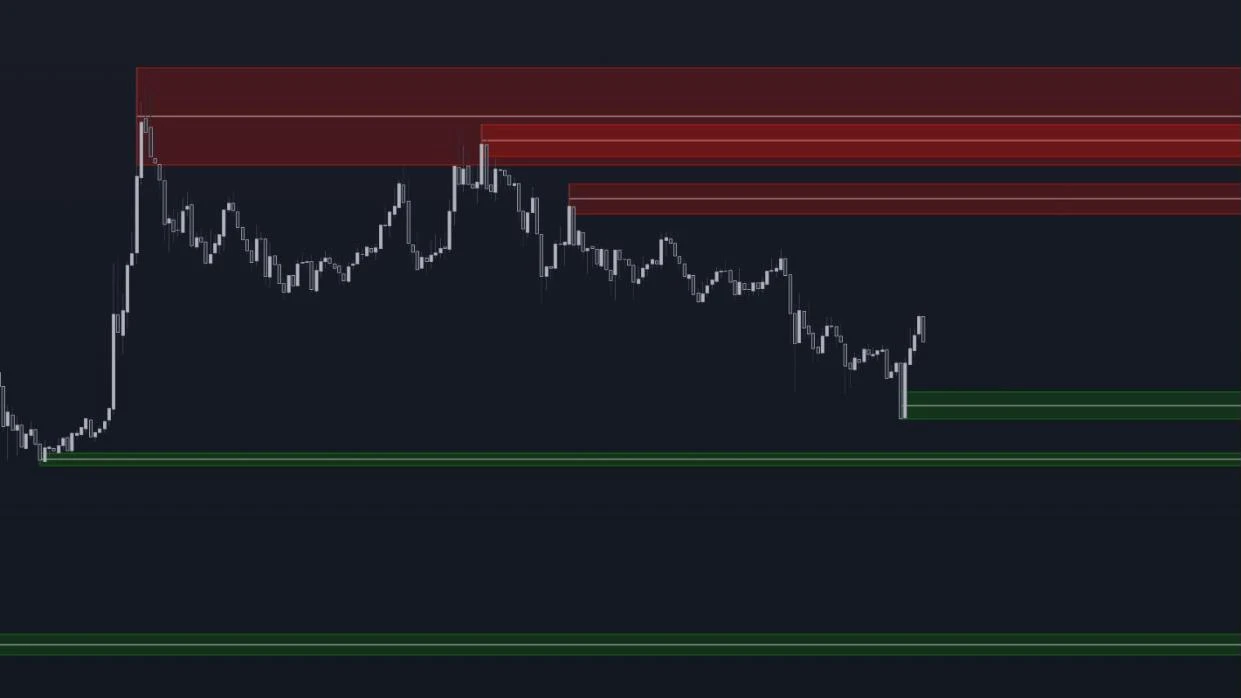
Order Block Detector [LuxAlgo]
Locates blocks from volume peaks at swing points and hides each one once price mitigates it.
View on TradingViewTest Your Order Block (OB) Knowledge
Eight quick questions on the candle that forms the block, the structure break, marking the zone, its strength signs, the entry and the breaker. Each answer links back to the section that explains it.
ABCD Answer with your keyboard
-
01Which candle forms a bullish order block?
A bullish OB is the last down-close candle before an upward displacement that breaks a recent swing high. Without that structure break, the candle is just the last down-close candle on the chart. Review: this section
-
02What makes the last opposite candle count as an order block?
The block only counts after the move away from it breaks a swing point. The sweep and the gap are strength signs, so a block can be valid without them. Review: How to Identify an Order Block
-
03How is an order block zone drawn?
The wick belongs to the zone because price traded there while the orders were placed. The open and the 50% level are lines inside the box, used later as entry lines. Review: How to Mark an Order Block Zone
-
04In a bullish order block, what is the sweep strength sign?
That small sweep clears the stops resting under the previous low before the rally starts. A block without it can still be valid, but it shows less evidence of large orders. Review: this section
-
05In a bullish block, which two prices show whether a fair value gap formed?
If the OB candle's high and the third candle's low do not overlap, the middle candle left a gap. In a bearish block, compare the OB candle's low with the third candle's high. Review: this section
-
06When does an order block become mitigated?
Even a wick counts. The candle right after the block starts at the zone, so it does not count. A fresh block, one price has not returned to yet, gives the cleaner first reaction. Review: this section
-
07Which entry fills most often but has the widest stop?
The wick entry sits at the near wick of the block, so it fills most often. Its stop goes a spread beyond the far wick, which makes it the widest of the four entries. Review: this section
-
08After a liquidity run, a candle body closes through a bullish order block. What does the zone become?
The failed zone then works in the opposite direction. A failed bullish OB becomes a bearish breaker, and a failed bearish OB becomes a bullish breaker. The level is the same. Review: this section
Review your answers
Conclusion
An order block is the last opposite candle before a displacement that breaks structure. Mark it from high to low, wick included, and wait for the first return. The strongest blocks swept the previous candle's low or high, left a fair value gap and are still fresh. Read them on the higher timeframe and time the entry on a lower one. A close through the block is a sign that it may turn into a breaker.
Sources
- Market impact: Wikipedia
- The Inner Circle Trader (Michael J. Huddleston), home page: ICT's official site
- E-mini S&P 500 overview: CME Group
- E-mini Nasdaq-100 overview: CME Group
- Understanding order types, investor bulletin: Investor.gov (SEC)
- Bid-ask spread: Wikipedia
- Order Block Simplified, Smart Money Course: Smart Risk, YouTube
Be the first to share your thoughts on this article.