


A failure to manipulate happens when price takes out a high or low but fails to form the reversal you would normally expect at that level. Instead of fading the level, you wait for new continuation structure and trade the breakout in the direction price is already moving, with a higher timeframe bias behind the trade.
Key Takeaways
- A failure to manipulate is the missing reversal after a high or low is taken. It is not just price crossing a level.
- A reversal needs a change in the state of delivery: price closing back through the candles that led into the level. No close means no confirmed reversal.
- The entry comes from new continuation structure, with the stop on the new protected swing.
- It is not a standalone model. Pair it with higher timeframe bias and let candles close before you decide.
- The logic is fractal, so the same read works from the daily chart down to the 1-minute chart.
What Is Failure to Manipulate?
A range gives you two possible trades. Price can manipulate one side of the range, form a reversal and trade toward the other side. Or price can take that high or low and fail to reverse. The second outcome is a failure to manipulate.
In practical terms, a failure to manipulate happens when price takes out a high or low and does not form the reversal you would expect at that level. If price takes a range high, the usual plan is to look for a manipulation of that high and a move lower. When price cannot form a bearish change in the state of delivery there, there is no reversal to trade.
That failure is information. If price is failing to reverse lower, where is it likely to go? Higher. The same logic applies at a low: if the bullish reversal never forms, continuation lower becomes the expectation.
This is why a failure to manipulate is not simply a breakout. The trade does not come from price crossing a level. It comes from price failing to form the reversal that would have taken it back through the range.
Key Components of a Failure to Manipulate Setup
Each part of the setup answers one question about what price is doing at the level:
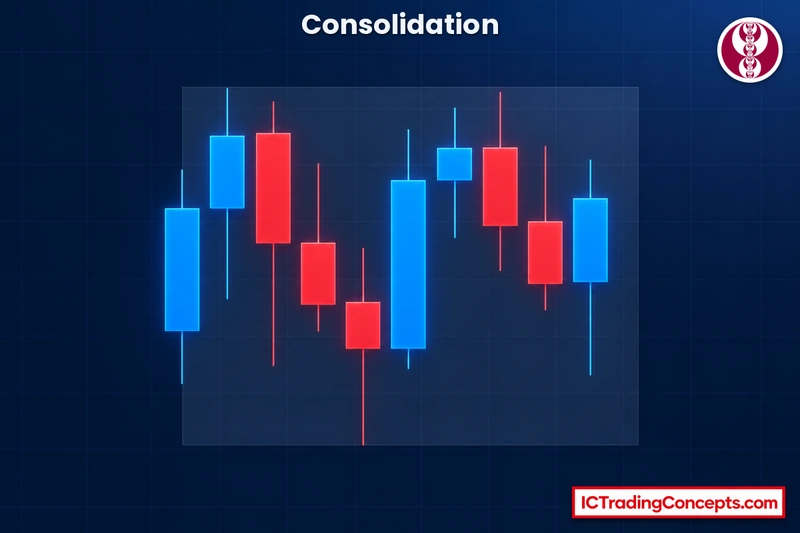
- The range or level. A consolidation with a clear high and low, such as equal highs and equal lows that have held for a series of candles. These edges are where you would normally look for a reversal.
- The level being taken. Price trades through the high or low. The sweep itself is not the trade. It only starts the test.
- The reversal test. To confirm a reversal at a high, price needs to close back through the series of candles that led into that high and form a bearish change in the state of delivery. At a low, it needs the bullish version.
- Continuation structure. If the reversal never forms, price retraces or retests the old range and builds a higher low or a lower high. That gives you a new protected swing.
- Higher timeframe bias. The reason to expect that direction in the first place. Structure tells you what price is doing. The higher timeframe tells you why you are looking for it.
How a Failure to Manipulate Forms
The setup unfolds in a clear order. Watch the phases of price after the level is reached instead of reacting to one candle:
- Price reaches a range high or low, often after an expansion into the range.
- The level gets taken.
- You wait for the reversal: an aggressive move in the opposite direction, followed by a change in the state of delivery.
- The reversal fails to form. Price consolidates, retraces or keeps expanding in the same direction without closing back through the level.
- A new continuation forms, often as a retest of the previous range, and price breaks out.
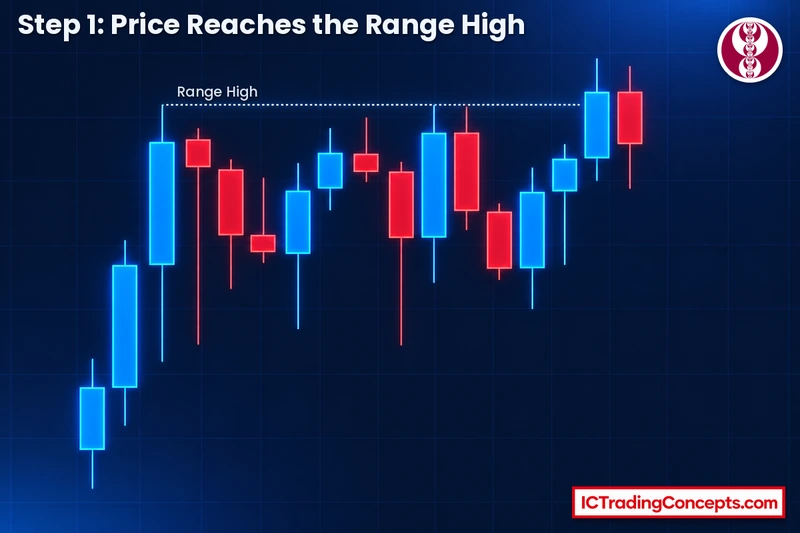
In the next step, price takes that high. A bearish reversal would need a close back through the series of candles that led into the high. The pullback candle dips back into the range but never makes that close, and price then closes back above the pullback candle's open, so a new continuation forms above the old high.


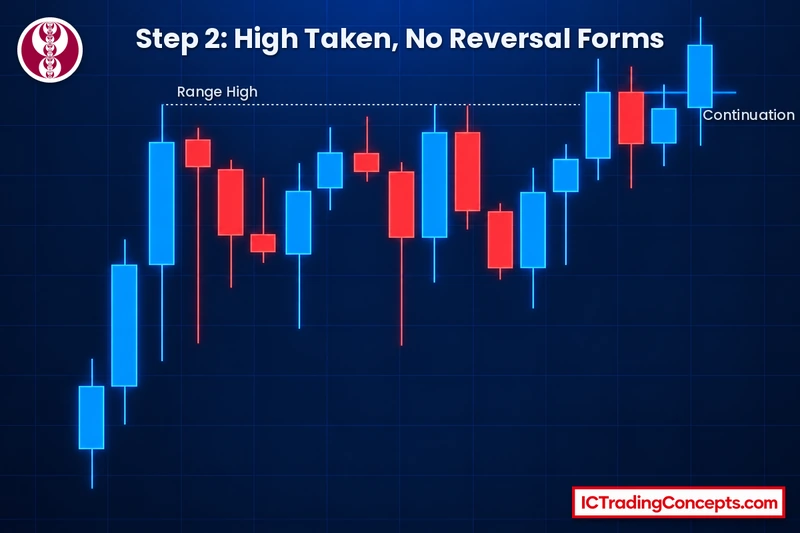
A retracement after the level is taken is not a reversal. When price trades into a high, shows no reversal on the lower timeframe and simply pulls back, the next higher low becomes the place to get on side with the move higher.
Manipulation vs. Failure to Manipulate: How to Tell Them Apart
After price takes a high or low, ask one question: did the reversal actually form? The two outcomes look the same at first and only separate after the next candles close.
| Manipulation | Failure to manipulate | |
|---|---|---|
| After the level is taken | Aggressive move back in the opposite direction | Consolidation, retracement or more expansion in the same direction |
| Change in the state of delivery | Forms: price closes back through the candles that led into the level | Does not form |
| What you look for next | The reversal toward the other side of the range | Continuation and a breakout in the direction price is moving |
If the reversal forms, you are looking at accumulation, manipulation and distribution: the level was taken to reverse. If it does not form, do not force the reversal. This distinction keeps you from automatically fading every high or low that gets swept.
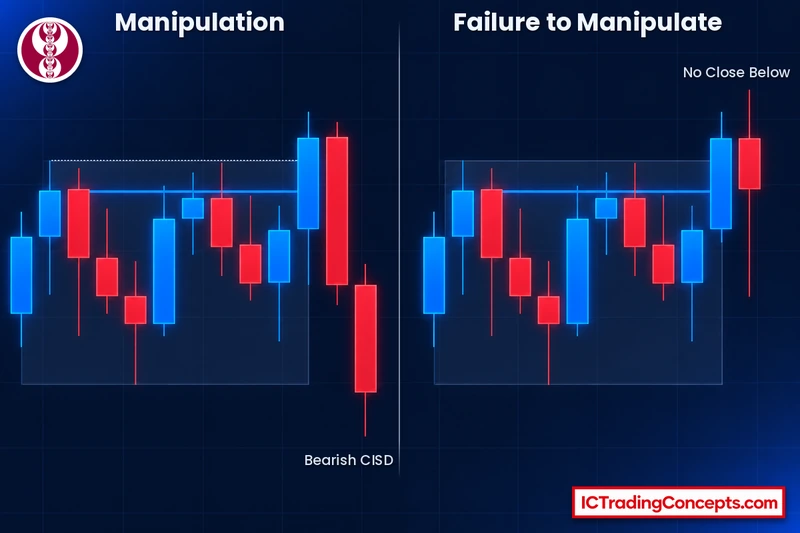
Wait for the Candle Closures
Candle closures keep the process mechanical. When price takes a level, do not assume the reversal has formed. Wait for the candle to close.
If you are looking for a reversal and the candle cannot close through the level you need, the reversal is not confirmed. If price instead continues and prints a new continuation, that failure to reverse becomes part of the setup. A single candle can often go either way, so let the structure form before you decide.
Confirm on the Lower Timeframe
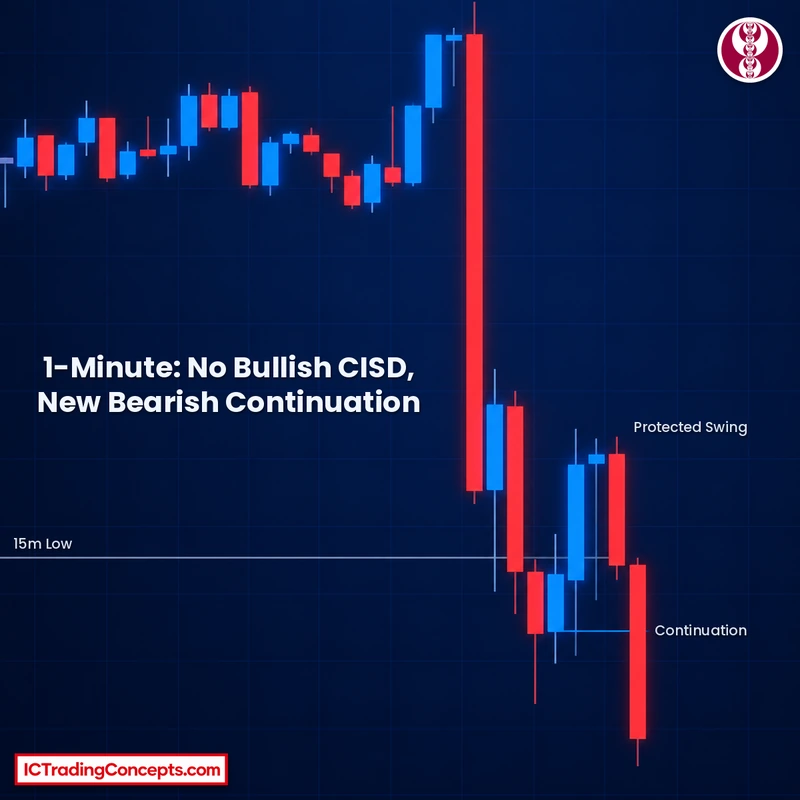
The lower timeframe shows whether the reversal is really forming. Say price trades into a 15-minute low and you are watching for a bullish manipulation. Drop to the 1-minute chart and look for the change in the state of delivery: a series of candles into the low, then a close back over them, then a protected swing.


If price fails to do that and instead forms a lower high or a new bearish continuation, the level was not manipulated for a reversal. That is the failure to manipulate, and continuation lower becomes the expectation.
Bullish Failure to Manipulate
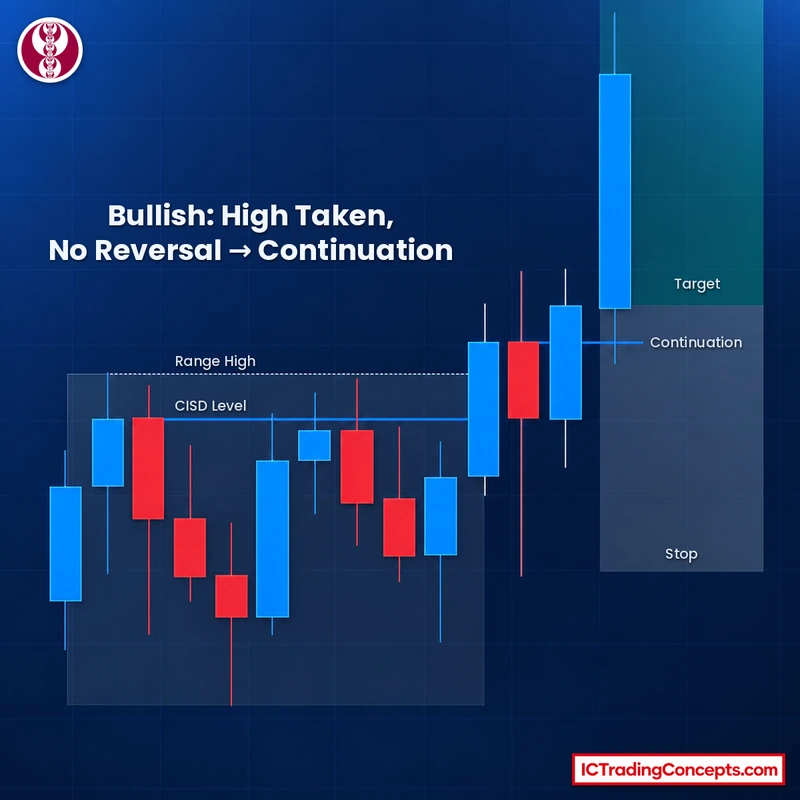
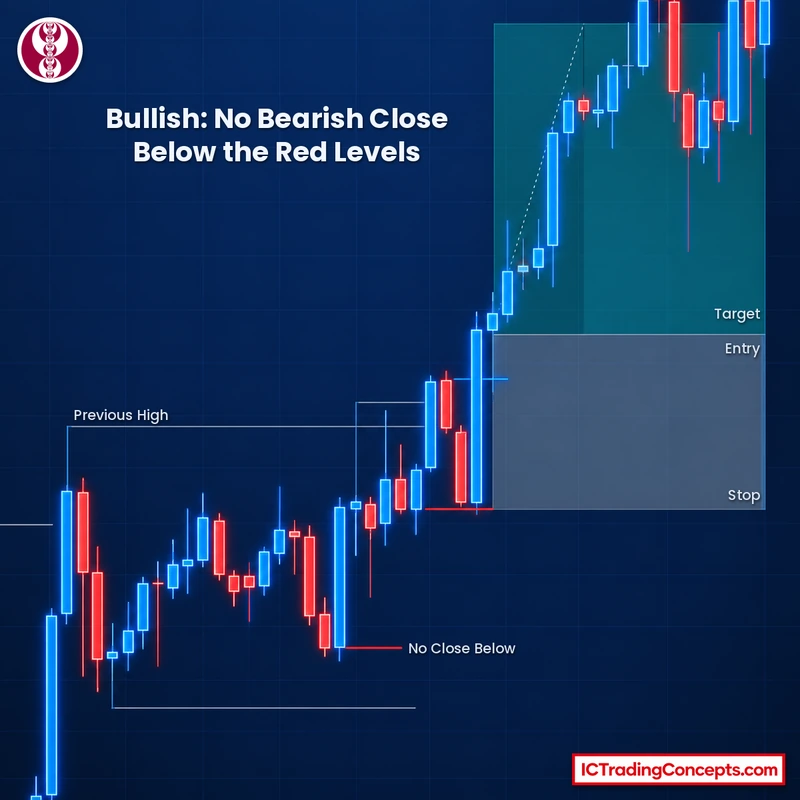
A bullish failure to manipulate forms at a high. Price takes the high, but instead of a bearish change in the state of delivery, it holds and keeps moving up.
In a bullish example, a reversal takes out a previous high and price moves into a consolidation. A bearish reversal off that high would need price to close below the candles that led into it. It never does. Price makes a high and cannot close below it, makes a new high and cannot close below that either. Instead, it prints a very aggressive bullish closure, which is the failure to manipulate the level.
The trade follows the breakout: price breaks out over the high, retests back into the gap and forms an ideal candle 2 closure. That is where you could get on side long, with the stop on the low. If you had been framing only bearish ideas here, you would never have had a setup, because a bearish change in the state of delivery never formed.
Bearish Failure to Manipulate
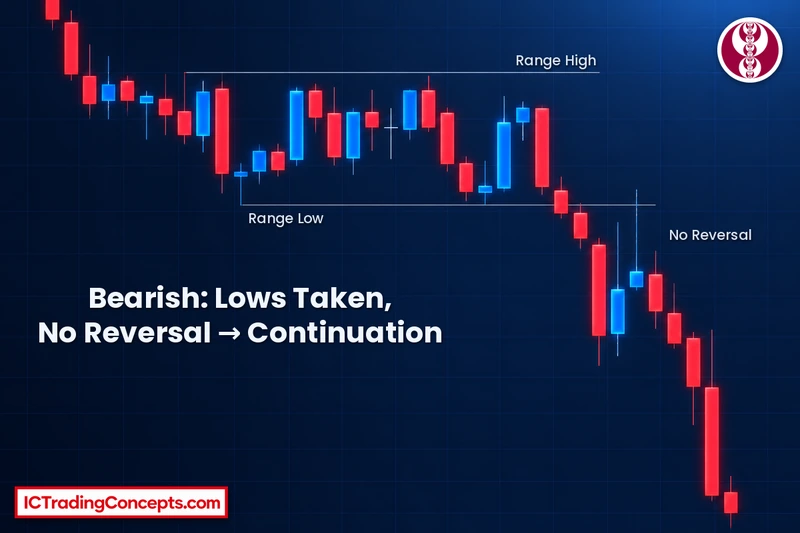
A bearish failure to manipulate forms at a low. Price takes the low but never produces the bullish change in the state of delivery needed to reverse higher, so the market continues lower.
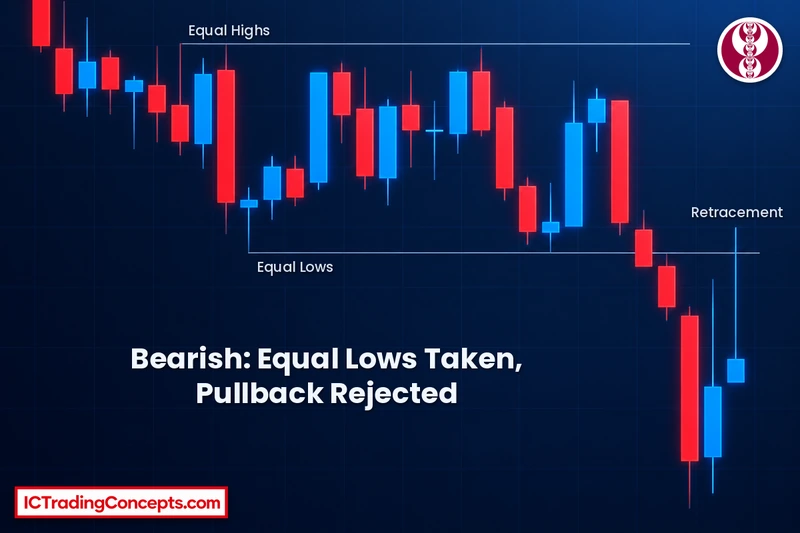
Picture a clear range with equal highs and equal lows that have held for a series of candles. When price reaches the lows, the question is whether it will manipulate them and reverse to the other side, or fail to do so. Price makes a very aggressive move lower. It reaches back up, but the wicks reject the previous range. That pullback is a retracement, not a reversal, and price continues lower.
This read is purely about structure: one side of the range is taken, no reversal forms, and the continuation follows.

How to Trade Failure to Manipulate Step by Step
The trade flow keeps the same order every time: bias first, then the level, then the missing reversal, then the entry.
- Start with a higher timeframe reason. Be bearish before looking for a bearish continuation, and bullish before looking for a bullish one.
- Mark the level. Use the range high or low, or a clear level such as a 15-minute low.
- Let price take the level. Do not trade the breakout candle itself.
- Watch for the reversal on the lower timeframe. Look for the change in the state of delivery and let each candle close.
- Confirm the failure. If the change in the state of delivery never forms and price builds a new continuation with a new protected swing, the level was not manipulated.
- Enter on the new continuation. A retest of the previous range or of the gap is where you get on side with the breakout.
- Place the stop on the protected swing. Below the protected low for a long, above the protected high for a short.
- Manage the target. There is no fixed target rule. In the examples, one trade used a 2R objective and another looked for expansion in the next higher timeframe candle.
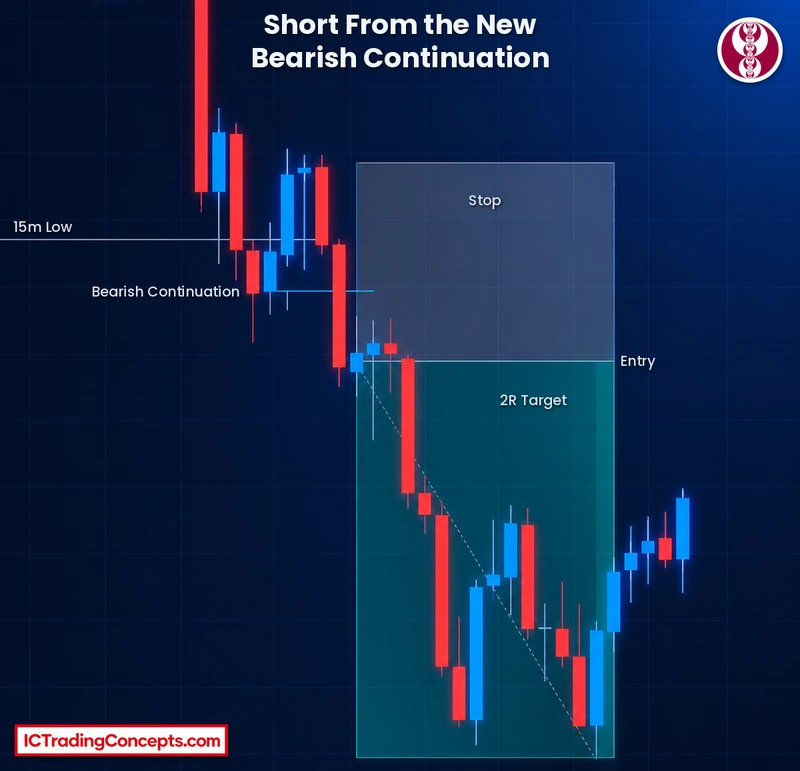
In a bearish execution example, price trades into a 15-minute low. On the 1-minute chart, the first candles could go either way and look like a possible bounce. Then an aggressive bearish candle prints and a new bearish continuation forms, with a new protected swing that is bearish. Price is not reversing off the 15-minute low, so the breakout of the range is traded short from that new continuation. The trade reaches 2R.
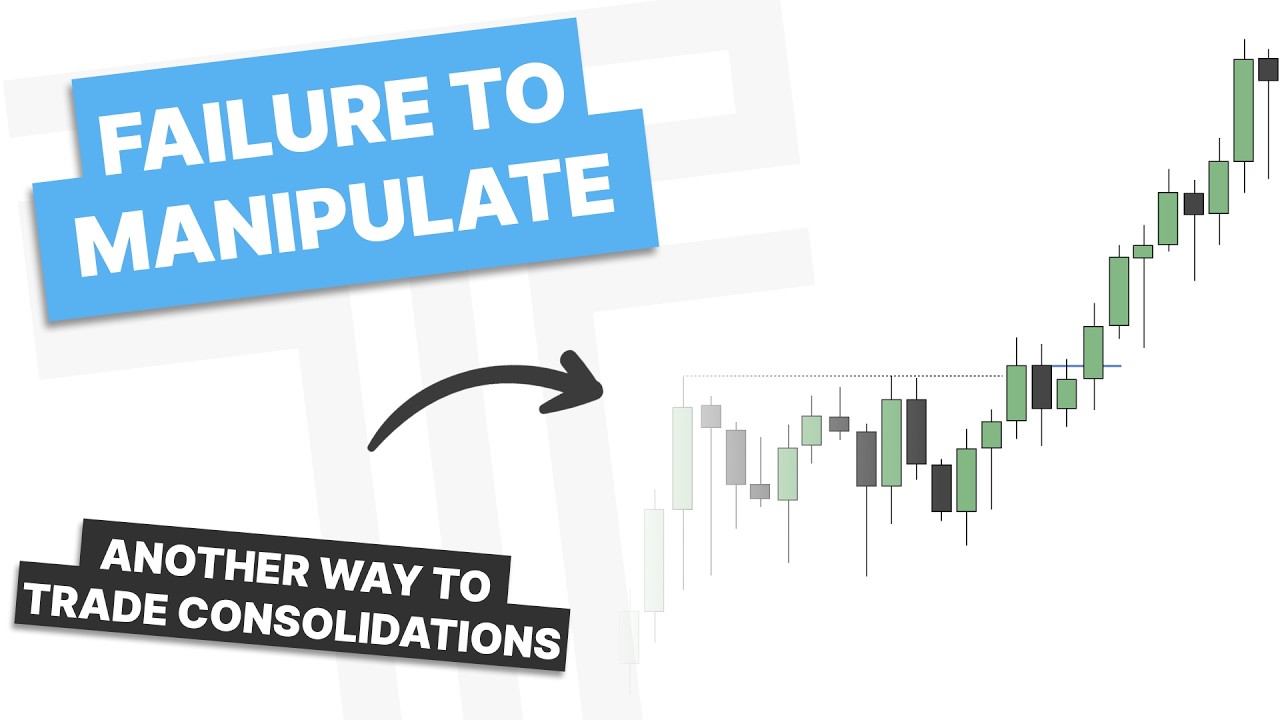
The video below walks through the concept and four chart examples, including this trade.
Why Higher Timeframe Bias Matters
Failure to manipulate is not a standalone model. On its own, it is structure confirmation. If you use structure blindly, you end up buying and selling breakouts with no reason behind them.
If you are trying to trade a bullish failure to manipulate, you want a reason to be bullish from the higher timeframe. The same applies to a bearish continuation. The higher timeframe provides the bias and the lower timeframe provides the structure confirmation. One way to do this is to plot the higher timeframe candles on the lower timeframe chart and read their closures.
Worked Example: A Bullish Setup With Higher Timeframe Candles
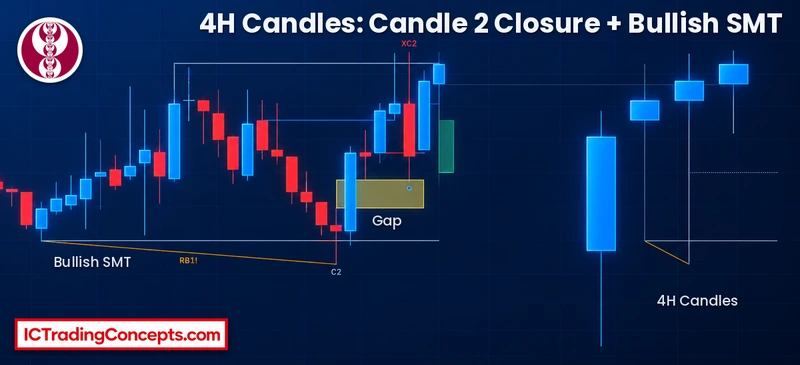
This example shows why structure alone can point the wrong way. The chart is a 15-minute chart with 4-hour candles plotted on the right side.
- Context. After a large expansion up, price consolidates and then takes the high of the consolidation.
- The mechanical read. A bearish change in the state of delivery forms. On structure alone, that suggests a manipulation of the high to trade lower.
- The higher timeframe read. The 4-hour candles tell a different story. Price is forming a candle 2 closure with a bullish SMT, so this is not treated as a manipulation of the range.
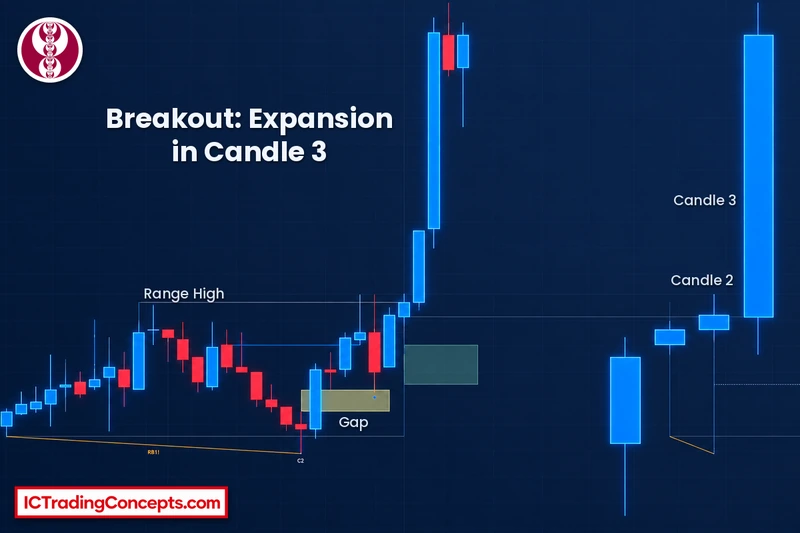
- The failure to manipulate. Price reaches lower into the gap and forms a bullish continuation with a new bullish protected swing. The high was taken, but no real reversal formed.
- The expectation. Price can break out of the range and expand higher in candle 3.
- The entry. The protected swing forms before the next higher timeframe candle opens. That makes it a positional entry: enter around the opening price, with the stop on the protected low.
The Logic Is Fractal: Which Timeframes to Use
The same process can happen on the daily, hourly, 30-minute, 15-minute or 1-minute chart. Price reaches a level, the level gets taken and you wait for the reversal. If the reversal forms, you can trade the manipulation. If it fails to form, you can look for continuation. The timeframe changes, but the logic stays the same.


In practice, each timeframe has a different job. The combinations below come from the examples and are a preference, not a rule:
| Job | Example timeframes |
|---|---|
| Bias | Daily chart, or higher timeframe candles such as the 4-hour |
| Setup and level | Hourly, 30-minute or 15-minute chart |
| Confirmation | A lower timeframe such as the 1-minute chart |
One preferred pairing is the hourly or 30-minute chart for the setup with the daily chart for bias.
Common Mistakes to Avoid
Most mistakes with this concept come from acting before price has shown which scenario it is building:
- Trading the breakout candle itself. Crossing a level is not the trade. Wait for a continuation to form first.
- Fading every high or low that gets swept. Without a change in the state of delivery, there is no reversal to trade.
- Deciding before the candle closes. A candle that looks like a reversal can still fail to close through the level you need.
- Trading structure without a higher timeframe bias. Without that reason, you are just blindly trading breakouts.
- Trusting a mechanical change in the state of delivery on its own. As the worked example shows, the higher timeframe candles can turn an apparent bearish reversal into a bullish failure to manipulate.
- Framing only one direction. If you only look for bearish reversals, a market that keeps failing to form bearish structure will never give you a setup.
Failure to Manipulate Indicators
Indicators can speed up the marking, but the read still depends on candle closures and bias:
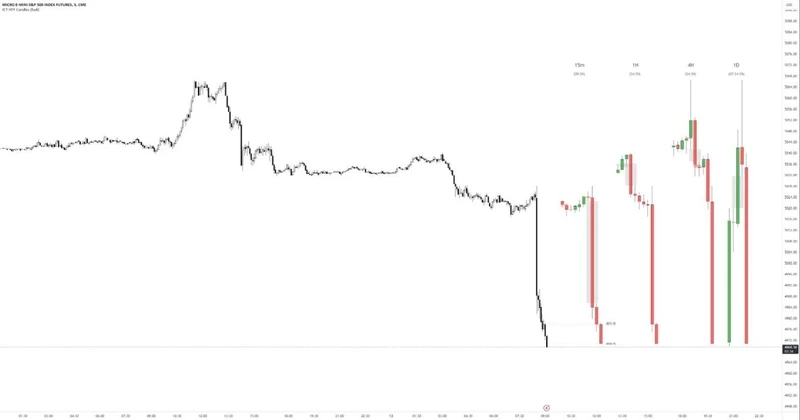
ICT HTF Candles [Source Code] (fadi)
Plots higher timeframe candles, with their FVGs and volume imbalances, beside the lower timeframe chart, so you can watch the candle closures that decide whether a taken level is reversing or continuing.
View on TradingView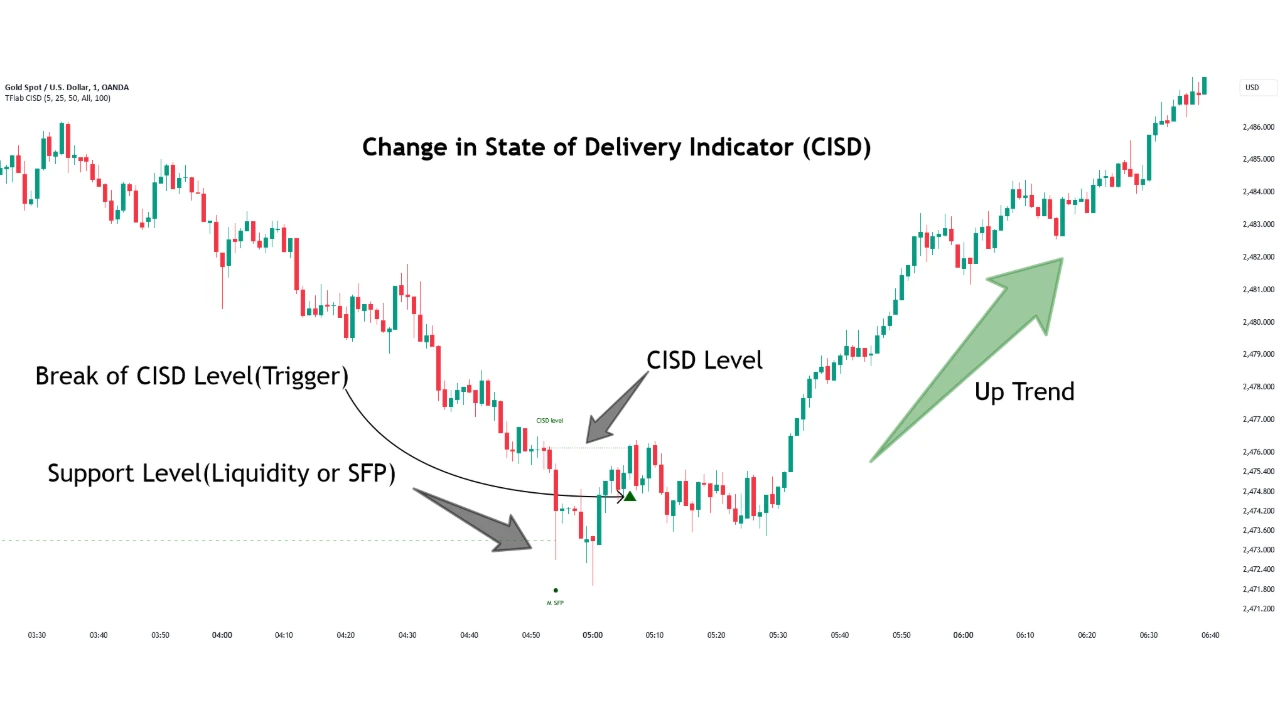
Change in State of Delivery CISD ICT [TradingFinder]
Marks change in the state of delivery levels automatically, so you can check whether the reversal test has been passed after a high or low is taken.
View on TradingView
SMT Divergences [LuxAlgo]
Marks diverging swing points between the chart and one or two correlated symbols, the SMT confirmation used with the higher timeframe candle closure in the worked example.
View on TradingViewTest Your Failure to Manipulate Knowledge
Eight quick questions on the missing reversal, the change in the state of delivery, the entry, the stop and higher timeframe bias. Each answer links back to the section that explains it.
ABCD Answer with your keyboard
-
01What is a failure to manipulate?
The setup is the missing reversal, not price crossing a level. When price takes a high or low and cannot reverse, continuation in the direction it is already moving becomes the expectation. Review: What Is Failure to Manipulate?
-
02What does price need to do to confirm a bearish reversal at a range high?
A reversal at a high needs a close back through the candles that led into it: the bearish change in the state of delivery. A wick back into the range, or a pullback without that close, is not a reversal. Review: Key Components of a Failure to Manipulate Setup
-
03Price takes a range high, then pulls back into the range without closing back through the candles into the high. What is the pullback?
A retracement after the level is taken is not a reversal. Without the bearish close, the next higher low becomes the place to get on side with the move higher. Review: How a Failure to Manipulate Forms
-
04How does a manipulation differ from a failure to manipulate after a level is taken?
After the level is taken, a manipulation brings an aggressive move back and a change in the state of delivery. A failure to manipulate shows consolidation, retracement or more expansion in the same direction, with no change in the state of delivery. Review: Manipulation vs. Failure to Manipulate: How to Tell Them Apart
-
05Where does the entry come from in a failure to manipulate trade?
Do not trade the breakout candle itself. Once the reversal fails and a new continuation forms with a new protected swing, a retest of the old range or of the gap is where you get on side. Review: How to Trade Failure to Manipulate Step by Step
-
06Where does the stop go for a long after a bullish failure to manipulate?
The stop goes on the new protected swing: below the protected low for a long, and above the protected high for a short. Review: Bullish Failure to Manipulate
-
07Why is a higher timeframe bias needed for this setup?
Failure to manipulate is structure confirmation, not a standalone model. The higher timeframe gives the reason to expect the direction, and the lower timeframe confirms the structure. Review: Why Higher Timeframe Bias Matters
-
08Which timeframe pairing does the article give as one preferred combination?
The logic is fractal, so it works from the daily chart down to the 1-minute chart. One preferred pairing is the hourly or 30-minute chart for the setup with the daily chart for bias, and a lower timeframe such as the 1-minute chart for confirmation. Review: The Logic Is Fractal: Which Timeframes to Use
Review your answers
Conclusion
A failure to manipulate is not simply a breakout. It is the failure of price to form the reversal you were expecting after taking a high or low, and that failure tells you where price is more likely to go.
Pair the structure with higher timeframe bias, wait for the candle closures and use the lower timeframe to confirm the new protected swing before you get on side. To build the skill, go back through your charts in hindsight, without needing replay, and mark what price looked like when it manipulated a level and when it failed to.
Sources
- How to Trade Breakouts (Failure to Manipulate), video
- Breakout (technical analysis): Wikipedia
Be the first to share your thoughts on this article.