

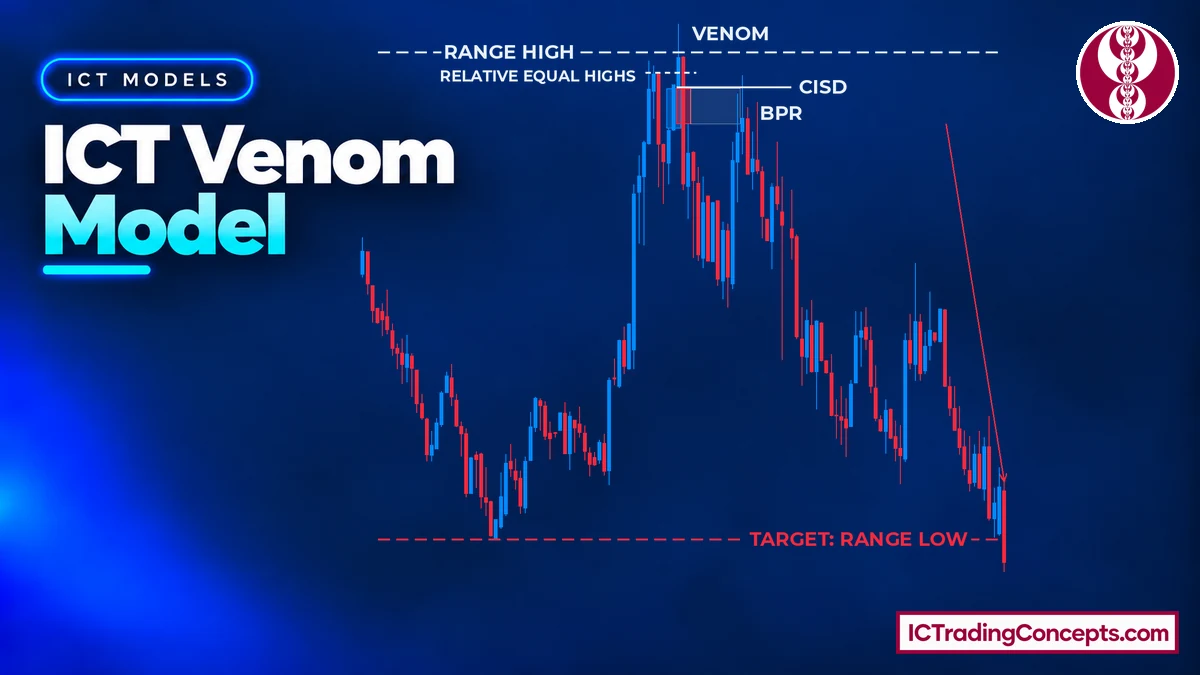
The ICT Venom Model is an intraday reversal setup that Michael J. Huddleston (ICT) taught in his 2025 Lecture Series. You mark the high and low of the 08:00–09:30 New York range as the reference levels, let your directional context set the expected side of the sweep, and wait for price to raid that side after the 09:30 open. The entries after confirmation come once price trades through the range high or low, a Venom candle closes beyond the liquidity it swept, a fair value gap forms on the way in and another on the way out, and a change in state of delivery (CISD) confirms the reversal. The aggressive entry is taken earlier, as price runs into the liquidity, before the setup is complete. The target is the opposite side of the range.
Key Takeaways
- The model uses one window: the 08:00–09:30 New York range. Its high marks the buy-side liquidity and its low marks the sell-side liquidity.
- The market needs directional context and a clear liquidity target. The range sets the reference levels; directional context sets the expected side of the sweep.
- The signature: after 09:30, price trades through the range high or low (a wick is enough) and a Venom candle closes beyond the swept liquidity, with a fair value gap on the move into it and an opposite fair value gap on the move away.
- Confirmation is a CISD: a close back beyond the opening price of the Venom candle, also called the Venom order block.
- The target is the opposite side of the range. The aggressive entry at the swept level comes before CISD; the Venom order block and first presented FVG entries come after it.
What Is the ICT Venom Model?
The ICT Venom Model, also called the ICT Venom Trading Model, is an intraday strategy for US stock index futures. Michael J. Huddleston presented it in a dedicated lesson of his 2025 Lecture Series, the ICT Venom Model tutorial of April 3, 2025. The whole model is built around one fixed window, 08:00 to 09:30 New York time, and around how price treats the liquidity on one side of that window after the 09:30 open.
The name describes the price action. Price runs into the stop orders resting beyond the range, "poisons" the traders who own those stops, and then reverses sharply. The candle that strikes the liquidity and the fast move away from it look like two fangs on the chart.
In practice the setup has three stages. Liquidity builds above and below the range between 08:00 and 09:30. After the open, price raids the liquidity on one side. The reversal then delivers price toward the opposite side of the range.
The Logic Behind the Venom Model
Above the range high sit buy stops from short sellers and breakout buyers. Below the range low sit sell stops from long traders. When price trades through one side, those stops are triggered, and that flow of orders gives larger participants the liquidity to build positions in the other direction.
That is why the model does not treat the break of the range as a continuation signal. The run into the liquidity is the fuel, and the reversal is the trade. Traders who chase the breakout become the liquidity the setup is built on.


Key Components of the ICT Venom Model
Five parts build the setup. Each one has a specific job, and they only work as a sequence.
Directional Context and the Weekly Draw
The ICT Venom Model needs a market that already has a direction and a clear liquidity target. The range sets the reference levels; directional context sets the expected side of the sweep. In a bullish week, expect the sweep on the sell side, at the range low; in a bearish week, expect it on the buy side, at the range high.
Context also tells you when to stand aside. Venom does not form in the middle of a trading range, or after several large range candles have already run up or down. According to the lesson, a Venom does not form without directional context.
The 08:00–09:30 New York Range
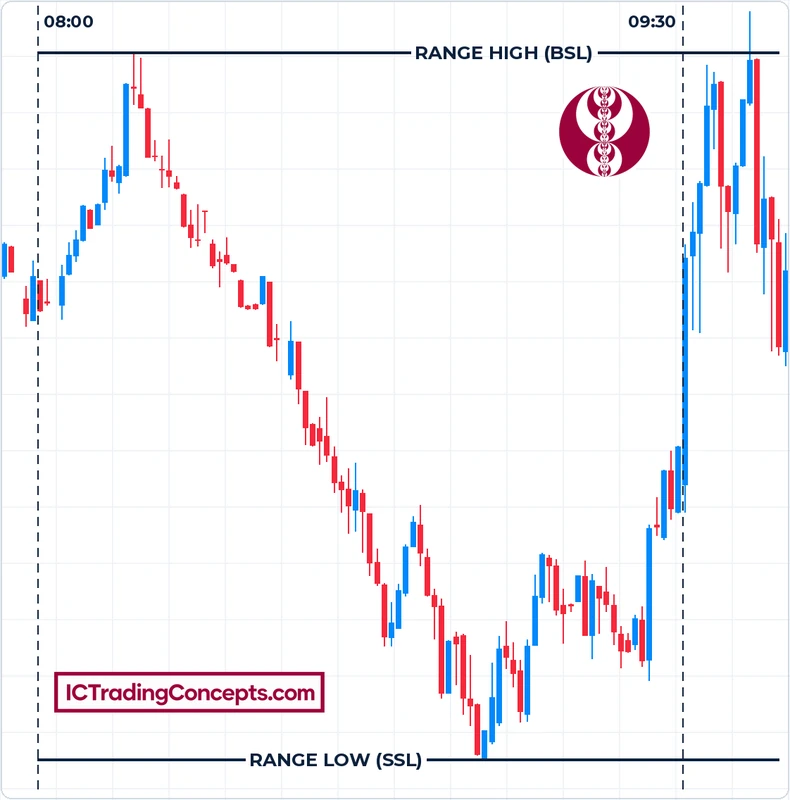
At 09:30, look back to 08:00 and mark the highest and lowest price inside that 90-minute window. The high marks the buy side and the low marks the sell side. These are the reference levels for the open; your directional context sets the expected side of the sweep.
This is a specific window, not a generic 90-minute cycle. It is also not the start of electronic trading: index futures trade on CME Globex from 6:00 p.m. ET the previous evening, so everything before the 09:30 cash open is already electronic trading. The window is simply the last 90 minutes before that open.
The Sweep and the Venom Candle Close
After 09:30, price has to reach the range high or low on the side your context points to and trade through it; a wick through the range extreme is enough for the sweep. The Venom candle then closes beyond the swept liquidity: the range extreme itself, or relative equal highs or lows that formed near it after 09:30 on the same side. An unrelated swing elsewhere inside the range does not count. A wick alone does not make the Venom candle; the close shows that price has been delivered into the pool of stops. The April 3, 2025 example has both: the wick took the range high, and the close came above the relative equal highs just below it.

If price does not go to the liquidity on that side and simply moves away, there is no Venom setup. You do not adjust the levels to force one.
The Two Fair Value Gaps and When They Form a BPR
The move into the Venom candle has to be inefficient, which means it leaves a fair value gap. The move away from it has to be inefficient as well, leaving an opposite FVG. A fair value gap is a three-candle pattern: the gap between the wick of the first candle and the wick of the third candle, created by a large second candle.
These two gaps are the "fangs" of the setup. A bearish Venom has a bullish FVG on the run up and a bearish FVG on the drop away; a bullish Venom has the reverse. When the two gaps overlap in price, the shared area is a balanced price range (BPR). If they do not overlap, they are simply two opposite fair value gaps.
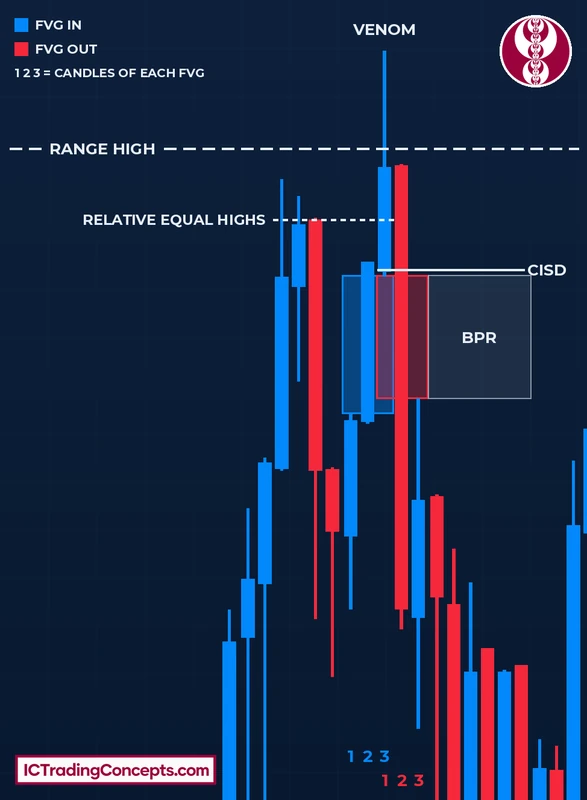
In the bearish example above, the Venom candle closes above the relative equal highs it sweeps, and the next candle closes far below its open. The bullish version is the educational mirror of the same logic: a candle closes below the sell-side liquidity it sweeps, and the next move closes back above the Venom candle's open.
CISD at the Venom Order Block
The opening price of the Venom candle is the Venom order block. CISD is confirmed when a candle closes back beyond that opening price: below it in a bearish setup, above it in a bullish setup. That close shows that delivery has switched from the run into liquidity to the reversal.
The same level becomes the main entry reference after confirmation, which is why you mark it as soon as the Venom candle closes.

How the ICT Venom Model Forms
The order of events matters more than any single candle. A CISD without a close beyond the swept liquidity, or a close beyond it without the two gaps, is a different pattern.
- Context: the market has a direction and a clear liquidity target.
- 08:00–09:30: the range forms. Mark its high and low at 09:30 as the reference levels; the context from step 1 sets the expected side of the sweep.
- After 09:30: price runs to the range high or low on that side and trades through it (a wick is enough), leaving an FVG on the way.
- Venom candle: a candle closes beyond the swept liquidity (the range extreme, or relative equal highs or lows near it).
- Reversal: price leaves quickly and leaves an opposite FVG (a BPR if the two gaps overlap).
- CISD: a candle closes back beyond the Venom candle's opening price.
- Delivery: price moves toward the opposite side of the range.
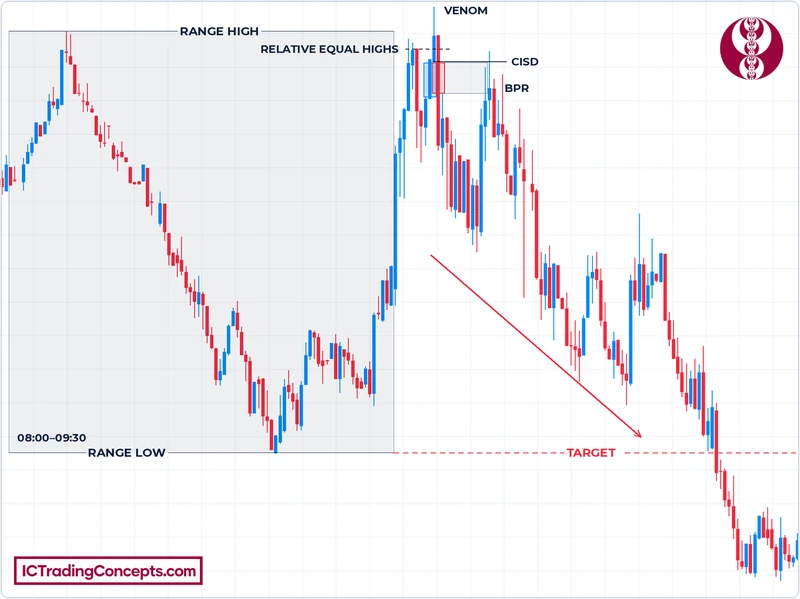
In a bearish formation, the run in step 3 goes up to the range high and the sweep trades through it. In a bullish formation, the run goes down to the range low and the sweep trades through it. The Venom close, the CISD and the reversal do not have to form beyond the range: on April 3, 2025, the wick took the range high, the Venom candle closed above the relative equal highs but below the range high, and the CISD and the reversal formed inside the range.
Bullish ICT Venom Model
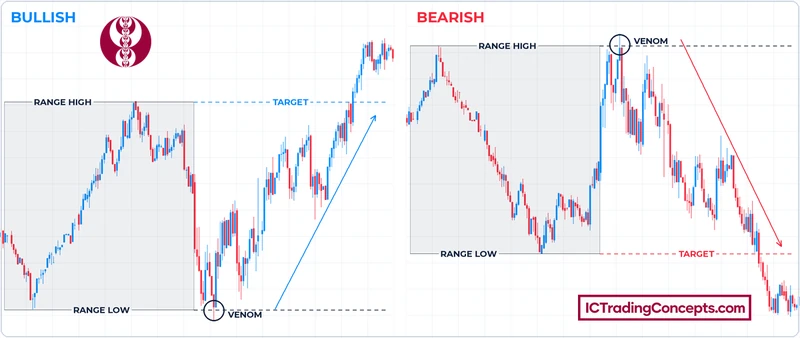
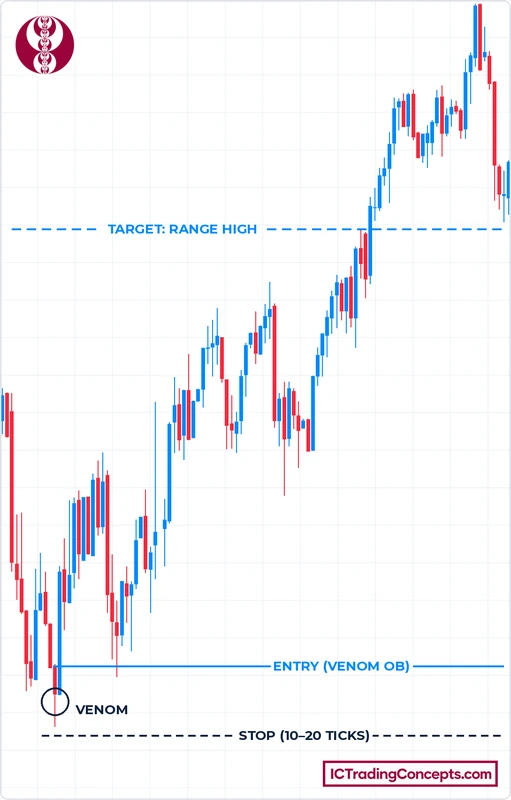
The lesson example is bearish, so the bullish form is presented as the educational mirror of the same logic: price raids the sell-side liquidity at the range low after 09:30 and reverses up toward the range high. The bullish charts in this article are the April 3, 2025 example flipped top to bottom as an educational illustration. They show the same sequence in reverse and are not a real market chart.
- Expect higher prices from the weekly context, then mark the 08:00–09:30 high and low.
- Wait for the 09:30 open.
- Price drops to the range low and trades through it (a wick is enough); the move down leaves a bearish FVG.
- Aggressive entry, before CISD: buy as price runs into that liquidity. This is the highest-risk option, and its stop has to be set before you enter, while the final sweep low is not yet known.
- A Venom candle closes below the swept liquidity: the range low, or relative equal lows near it.
- Price reverses up quickly and leaves a bullish FVG (a BPR if the two gaps overlap).
- CISD: a candle closes above the Venom candle's opening price.
- Entries after CISD: buy at the Venom order block, or later in the first presented FVG of the same sequence.
- Set the stop for each entry before it is executed; for the entries after CISD, 10–20 ticks below the sweep low is a reference approach.
- Target the range high.
Bearish ICT Venom Model
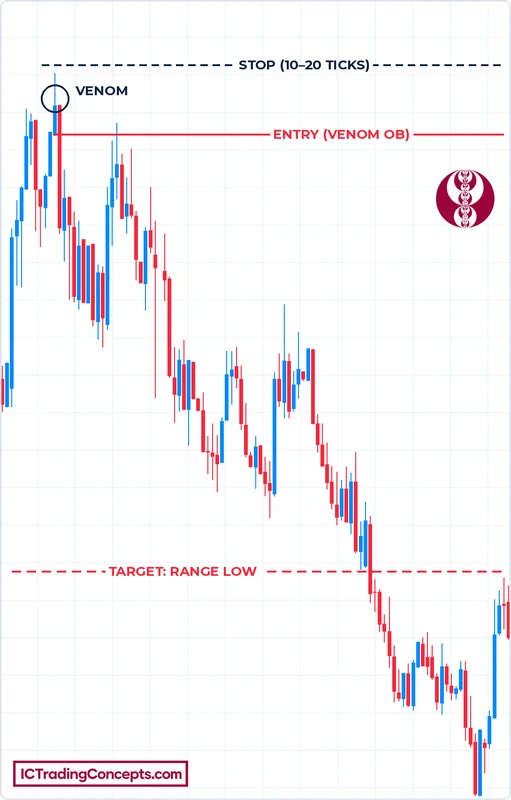
On a bearish day, price raids the buy-side liquidity at the range high after 09:30 and reverses down toward the range low.
- Expect lower prices from the weekly context, then mark the 08:00–09:30 high and low.
- Wait for the 09:30 open.
- Price rallies to the range high and trades through it (a wick is enough); the move up leaves a bullish FVG.
- Aggressive entry, before CISD: sell as price runs into that liquidity. This is the highest-risk option, and its stop has to be set before you enter, while the final sweep high is not yet known.
- A Venom candle closes above the swept liquidity: the range high, or relative equal highs near it.
- Price reverses down quickly and leaves a bearish FVG (a BPR if the two gaps overlap).
- CISD: a candle closes below the Venom candle's opening price.
- Entries after CISD: sell at the Venom order block, or later in the first presented FVG of the same sequence.
- Set the stop for each entry before it is executed; for the entries after CISD, 10–20 ticks above the sweep high is a reference approach.
- Target the range low.
How to Spot a Valid Venom Setup
A valid setup passes every check below. If one check fails, the chart may still show a reversal, but it is not a Venom.
| Check | Valid | Not valid |
|---|---|---|
| Context | Directional market with a clear liquidity target | Middle of a trading range, or after several large range candles |
| Sweep | Price reaches the range high or low on the side your context expects and trades through it; a wick is enough | Price stops short of the range extreme, or sweeps the opposite side |
| Timing | The raid happens after 09:30 | The move happens before the open |
| Close | The Venom candle closes beyond the swept liquidity: the range extreme, or relative equal highs or lows near it on the same side | No candle closes beyond the swept liquidity, or the close is measured against an unrelated swing inside the range |
| Inefficiency | An FVG on the move in and an opposite FVG on the move out | Slow, overlapping candles on either side |
| Confirmation | A close back beyond the Venom candle's opening price | No close back through that level |
The most common false signal is the wick-only move. Price pokes through the sell-side liquidity, closes back above it on the same candle, and no candle ever closes beyond the swept liquidity. The wick can complete the sweep of the range low, but without that close there is no Venom candle. The same test applies to buy-side liquidity in a bearish setup.


Step-by-Step Trade Flow
The trade flow follows the same order every session. Steps 1 to 4 happen before any decision. The aggressive entry in step 6 comes before CISD; the entries in step 10 come after it.
- Be at the chart by 08:00 New York time and watch the range form.
- At 09:30, mark the range high and low as the reference levels.
- Take the expected side of the sweep from your directional context: the sell side at the range low for bullish days, the buy side at the range high for bearish days.
- Do not enter before 09:30.
- Watch for the run to the range high or low and through it (a wick is enough), and confirm the fair value gap it leaves.
- Aggressive entry, before CISD (optional): enter as price runs into the liquidity, with its stop set before you enter; the final sweep extreme is not known yet.
- Wait for a Venom candle that closes beyond the swept liquidity (the range extreme, or relative equal highs or lows near it).
- Wait for the fast reversal and the opposite FVG.
- Confirm CISD: a close back beyond the Venom candle's opening price.
- Entries after CISD: the Venom order block, or the first presented FVG later in the same sequence, each with its stop set before execution.
- Target the opposite side of the range.
Entry Options
The lesson covers three entries. The aggressive entry comes before CISD; the Venom order block and FVG entries come after it.
- Aggressive entry: sell as price runs into the buy-side liquidity, or buy as it runs into the sell-side liquidity in a bullish setup. This is the highest-risk entry because it is taken before CISD, so it needs strong context and conviction.
- Venom order block: after CISD, place the entry at the Venom candle's opening price and wait for price to return to it. This is the lower-risk entry.
- Deferred entry: after CISD, enter when price trades back into the first presented FVG of that same sequence. It is a later option in the same sequence.
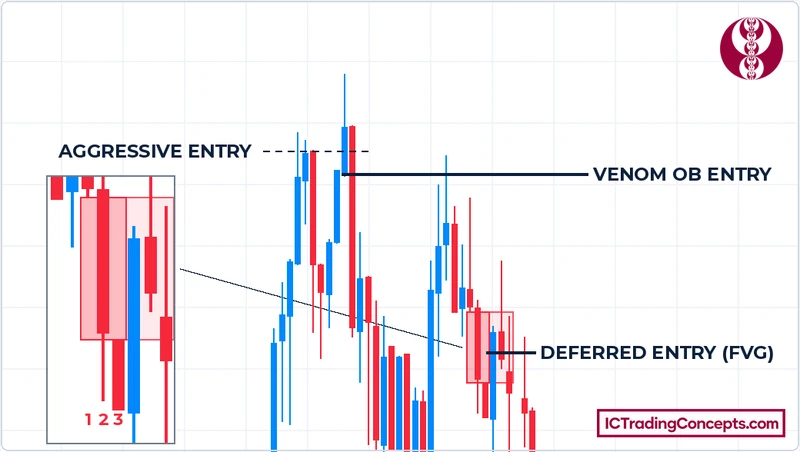
On the bearish chart, the three entries sit at different heights: at the swept highs, at the Venom candle's open, and inside the first presented FVG after the breakdown. In a bullish setup the same three references sit on the sell side, mirrored.
Stop Loss Placement
Every entry path needs its own stop, set before the order is executed. For the Venom order block and FVG entries, the sweep extreme has already printed when you enter. For the aggressive entry, the final extreme of the sweep is not known yet, because price is still running into the liquidity.


A reference approach is to place the stop 10–20 ticks beyond the sweep extreme: below the sweep low in a bullish setup, above the sweep high in a bearish one. On E-mini Nasdaq-100 futures one tick is 0.25 index points, so the buffer is small in points.
A stop placed exactly at the sweep extreme sits where price has just traded, so a retest can take it out before the reversal develops.
Target: The Opposite Side of the Range
The target is the opposite side of the 08:00–09:30 range. In a bullish setup that is the range high; in a bearish setup it is the range low. The run from one side of the range to the other is the delivery the setup is built on.
Markets, Timeframe and Session Timing
The ICT Venom Model was designed for US stock index futures, because the 09:30 cash open is the event that triggers the raid on the range.
| Item | What the model uses |
|---|---|
| Markets | E-mini Nasdaq-100 (NQ), E-mini S&P 500 (ES) and E-mini Dow (YM) futures; the lesson example is NQ. Index CFDs are separate products, so their prices may not match the futures chart |
| Timeframe | The lesson reads the setup on the 1-minute chart |
| Range | 08:00–09:30 New York time |
| Signature | After the 09:30 open |
| Futures session | Trading starts at 6:00 p.m. ET the previous evening |
Use New York time for every level. If your platform runs on another time zone, convert the window before you mark the range, especially in the weeks when daylight saving time changes in one region but not the other.
Worked Example: NQ Futures on April 3, 2025
The lesson example is a bearish Venom on the 1-minute June Nasdaq-100 futures contract. NQ had opened sharply lower that morning and the expected direction was down, so the expected sweep was on the buy side, at the range high.
Two levels sat on that side. The 08:00–09:30 range high was the 08:15 high at about 19,061. After the open, price rallied and printed relative equal highs at about 19,050, roughly 10 points below it. Around 09:39 one candle drove through both: its wick took the 08:15 range high, and its body closed above the relative equal highs at about 19,058.5, below the 08:15 high. That candle was the Venom candle, closing beyond the equal-high liquidity it swept.
The run into it left a bullish gap, and the next candle dropped and closed near 18,998, far below the Venom candle's opening price of about 19,044. That close was the CISD, and the bearish gap it left overlapped the first one, forming a BPR. The three entries came at different points in that sequence: the aggressive short at the swept highs before the CISD, then the short at the Venom candle's open and the short in the first presented FVG after it. ICT used the deferred entry. Price later traded below the range low near 18,829, the sell side of the morning range.
The clip below is an edited version of the April 3, 2025 lesson. It covers the opening range, the Venom setup and how the trade was executed.
Common Mistakes and Invalid Setups
Many Venom losses come from trades the model never actually signaled. Check your setup against these errors before you enter:
- Entering before 09:30. The open is the catalyst. Positions taken during the range front-run a setup that has not formed.
- Trading without directional context. According to the lesson, a Venom does not form without directional context, so the middle of a trading range or a market that has already run on several large range candles is not a setup.
- Treating a wick as the signature. A wick can complete the sweep of the range extreme, but without a candle closing beyond the swept liquidity there is no Venom candle.
- Forcing the setup when price never reaches the range extreme. If price leaves without trading through the range high or low on the side your context expects, there is no Venom that day.
- Skipping CISD on a confirmation entry. The Venom order block and FVG entries wait for the close back beyond the Venom candle's open.
- Placing the stop exactly at the sweep extreme. A stop sitting on the sweep extreme can be taken on a retest before the reversal runs.
ICT Venom Model Indicators
Indicators can automate the marking work. They do not replace reading the sequence, because the context check still depends on you.
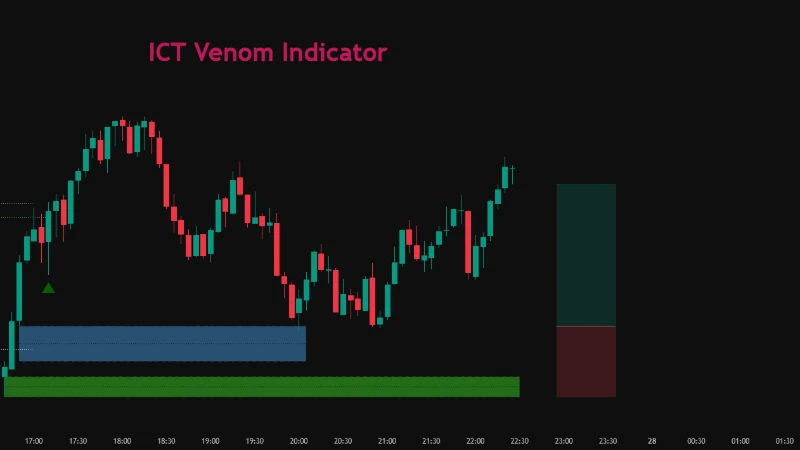
ICT Venom Trading Model [TradingFinder] SMC NY Session 2025Setup
Marks the 08:00–09:30 range, the sweep after the open, the CISD level, fair value gaps and order blocks for bullish and bearish setups.
View on TradingView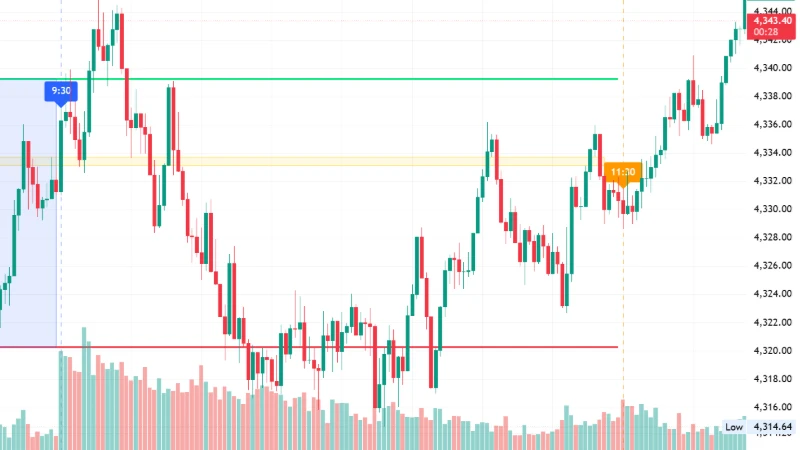
ICT Venom Core - Simple NY Setup
Marks 08:00 and 09:30 New York time, tracks the high and low of the 08:00–09:30 range and extends them through the morning, and highlights balanced price range (BPR) setups between 09:30 and 11:30.
View on TradingView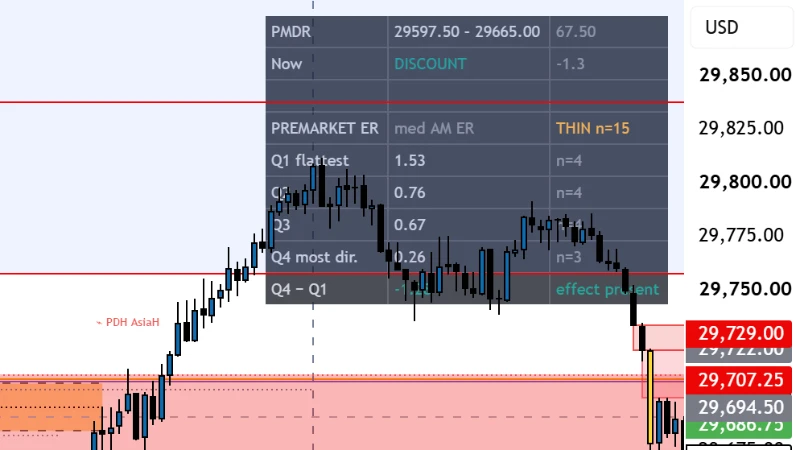
ICT Combined Venom Silver Bullet Displacement Liquidity
Marks CISD levels at the last opposing candle's open and the first presented FVG, two reference points used in the trade flow.
View on TradingViewTest Your ICT Venom Model Knowledge
Eight quick questions on the 08:00–09:30 range, the sweep, the Venom candle, CISD, the entries and the target. Each answer links back to the section that explains it.
ABCD Answer with your keyboard
-
01Which window does the ICT Venom Model use for its reference levels?
At 09:30 you look back to 08:00 and mark the high and low of that 90-minute window. It is a fixed window, the last 90 minutes before the cash open, not a generic 90-minute cycle. Review: this section
-
02In a bullish week, on which side of the range is the sweep expected?
Directional context sets the expected side of the sweep. In a bullish week, expect the raid on the sell side at the range low; in a bearish week, on the buy side at the range high. Review: this section
-
03After 09:30, price wicks through the range low, but no candle closes beyond the swept liquidity. What is it?
A wick through the range extreme is enough for the sweep, but the Venom candle has to close beyond the swept liquidity. The wick-only move is the most common false signal. Review: How to Spot a Valid Venom Setup
-
04What is the Venom order block?
The opening price of the Venom candle is the Venom order block. A close back beyond it confirms CISD, and the same level becomes the main entry after confirmation. Review: this section
-
05In a bearish Venom, when is CISD confirmed?
CISD is a close back beyond the Venom candle's opening price: below it in a bearish setup, above it in a bullish one. That close shows delivery has switched from the run into liquidity to the reversal. Review: How the ICT Venom Model Forms
-
06The FVG on the move into the Venom candle and the opposite FVG on the move away overlap. What is the shared area called?
The move in and the move out each leave a fair value gap in opposite directions. Where the two gaps overlap, the shared area is a BPR; if they do not overlap, they are simply two opposite FVGs. Review: this section
-
07Which entry is taken before CISD and carries the highest risk?
The aggressive entry is taken while price is still running into the liquidity, before CISD, so its stop has to be set before the final sweep extreme is known. The Venom order block and FVG entries come after CISD. Review: this section
-
08What is the target of a Venom trade?
The target is the opposite side of the range: the range high in a bullish setup and the range low in a bearish one. The run from one side of the range to the other is the delivery the setup is built on. Review: this section
Review your answers
Conclusion
The ICT Venom Model turns one narrow window into a complete plan. Mark the 08:00–09:30 high and low as the reference levels, let your directional context set the expected side of the sweep, and wait for the open. A sweep through the range extreme, a Venom candle that closes beyond the swept liquidity, two fair value gaps around it and a CISD at its opening price confirm the setup for the Venom order block and FVG entries; the opposite side of the range gives you the target. When any of these pieces is missing, there is no confirmation entry. The aggressive entry comes before the setup is complete, which is why it carries the most risk.
Sources
- ICT Venom Model tutorial, April 3, 2025: ICT, YouTube
- Micro E-mini equity index futures FAQ: CME Group
- E-mini Nasdaq-100 futures contract specs: CME Group
- Holidays and trading hours: NYSE
Be the first to share your thoughts on this article.