

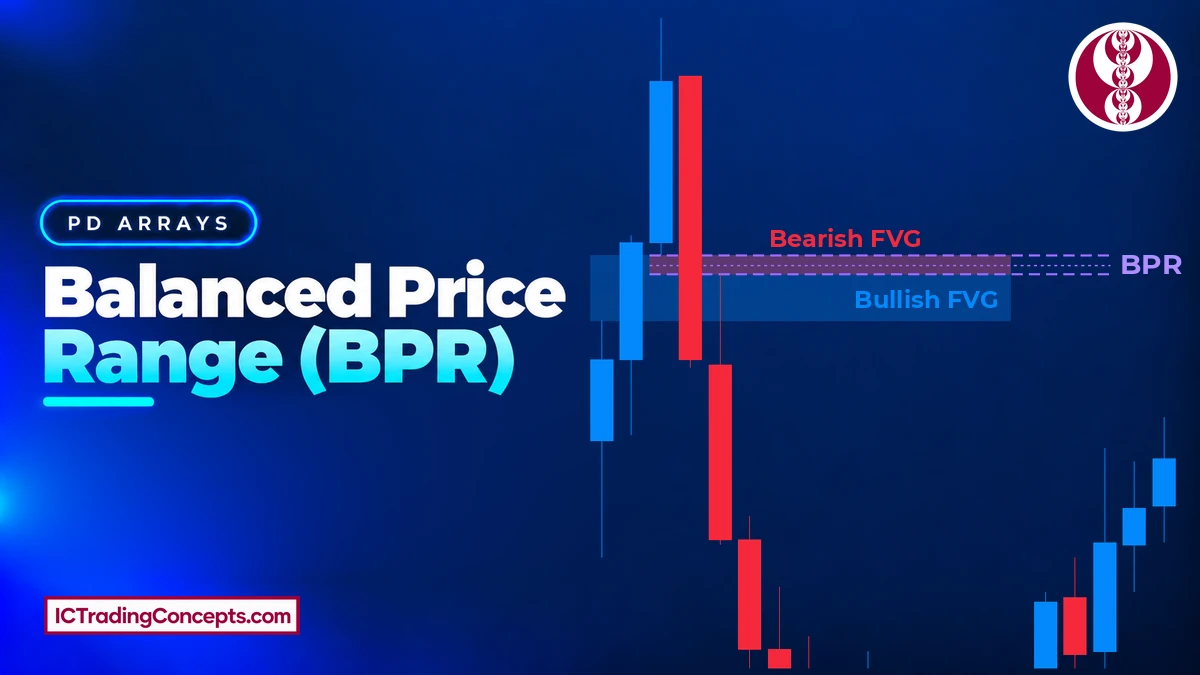
A balanced price range (BPR) is the price band where a bullish fair value gap and a bearish fair value gap overlap. Price has crossed that band twice, once in each direction, and each crossing was fast and one-sided. The newer gap gives the BPR its direction. Only the shared band is treated as the entry zone.
Key Takeaways
- A BPR exists only where a bullish FVG (BISI) and a bearish FVG (SIBI) truly intersect. Two opposite gaps that do not overlap are just two FVGs.
- The newer gap, printed by the displacement leg, sets the direction. A newer bullish FVG over an older bearish FVG is a bullish BPR.
- When one gap sits inside the other, the smaller gap is the whole BPR.
- Daily bias, a higher-timeframe PD array, a liquidity sweep and a market structure shift are setup filters. They are not part of the definition.
- Entries use the overlap only: the retest, or a limit order at its 50% level. The stop goes beyond the swing high (bearish) or swing low (bullish) before the shift, with a small buffer; in a sweep setup, that swing is the sweep's extreme.
What Is a Balanced Price Range (BPR) in ICT?
The ICT balanced price range is an Inner Circle Trader concept built on the fair value gap. A fair value gap (FVG) is a three-candle imbalance, marked wick to wick. In a bullish FVG it runs from the high of candle 1 to the low of candle 3. In a bearish FVG it runs from the low of candle 1 to the high of candle 3. ICT calls the bullish version BISI and the bearish version SIBI.
A BPR is the area where one bullish FVG and one bearish FVG cover the same prices. Only that shared band counts. If two opposite gaps sit close together but do not touch, there is no BPR.
The name describes what price did there. It crossed the band once with sellers in control and once with buyers in control. So the band has been delivered in both directions, and each pass left an FVG on the same prices. In BPR trading, that double footprint is why the overlap is watched more closely than a single gap.
The term comes from ICT, and SMC traders use the same overlap logic. You will also see it written as "balance price range". It is the same concept.
How Does a Balanced Price Range Form?
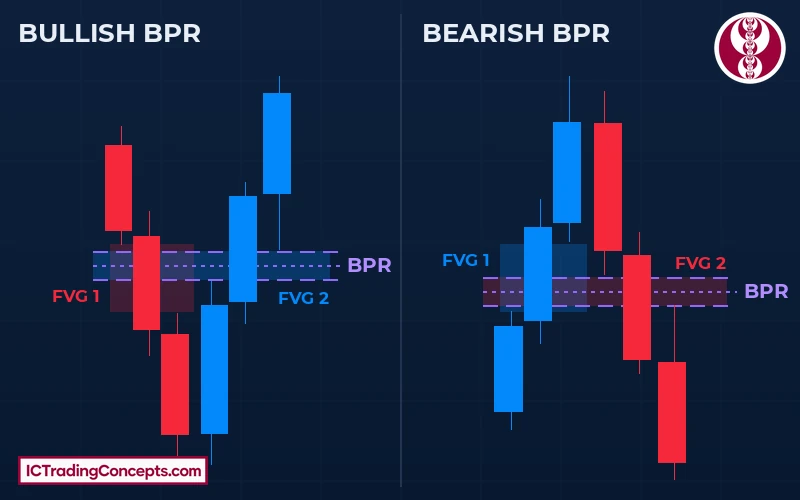
In the setup taught here, a BPR forms from two displacement legs in opposite directions. The usual sequence:
- A sharp move leaves the first FVG.
- Price reverses with similar force and trades back through that gap.
- The return leg prints an opposite FVG at the same prices.
- The overlap of the two gaps is the BPR. The newer gap names its direction.
A common place for this is the tip of a sharp "V". Price runs into a pool of liquidity, sweeps it and snaps back, breaking structure on the way. Each leg of the V leaves an FVG, and the two gaps line up.
Bullish Balanced Price Range
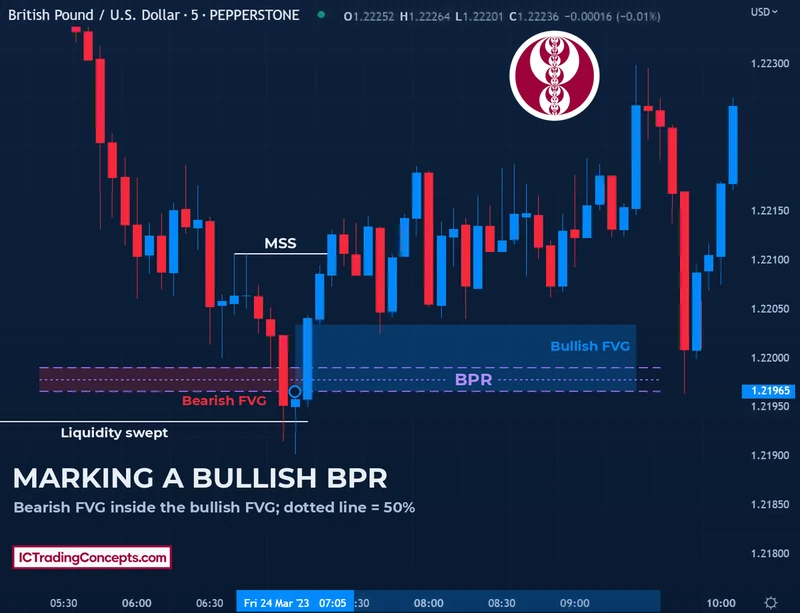
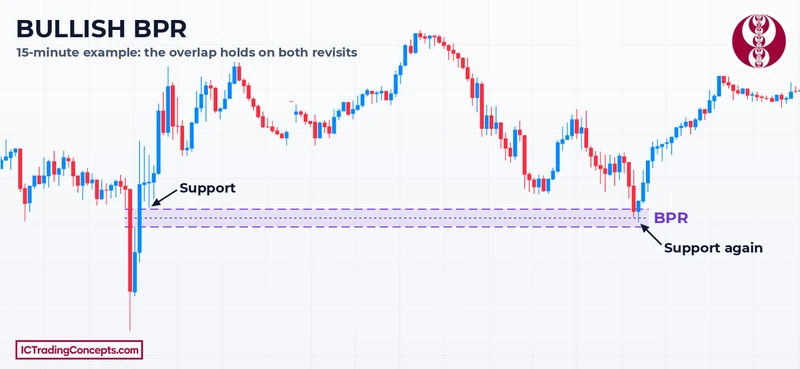
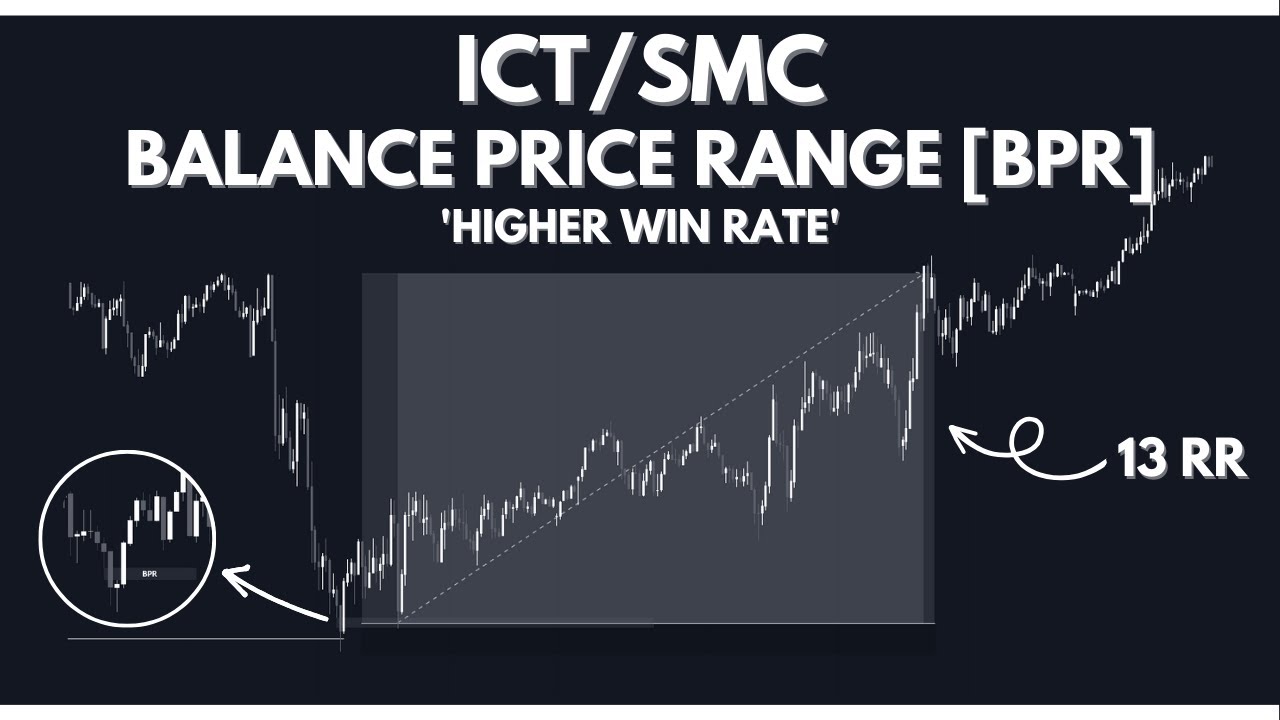
A bullish BPR forms when a newer bullish FVG overlaps an older bearish FVG. First a drop leaves the bearish FVG. Then a rally through it leaves the bullish FVG on the same prices. Once the rally is complete, the BPR sits below price. Traders use it for long entries on the retest, ideally in the discount half of the range.


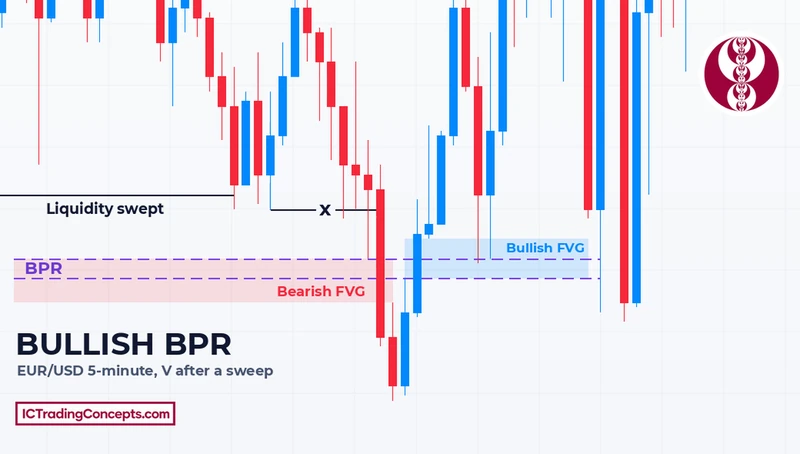
In the EUR/USD example above, price swept the liquidity under a recent low before the rally. The drop and the rally each left a gap, and the overlap became the long entry zone.
Bearish Balanced Price Range
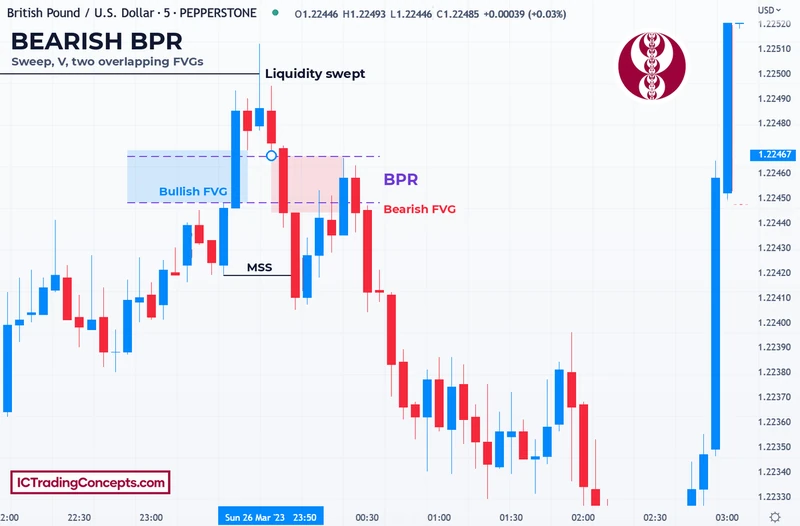
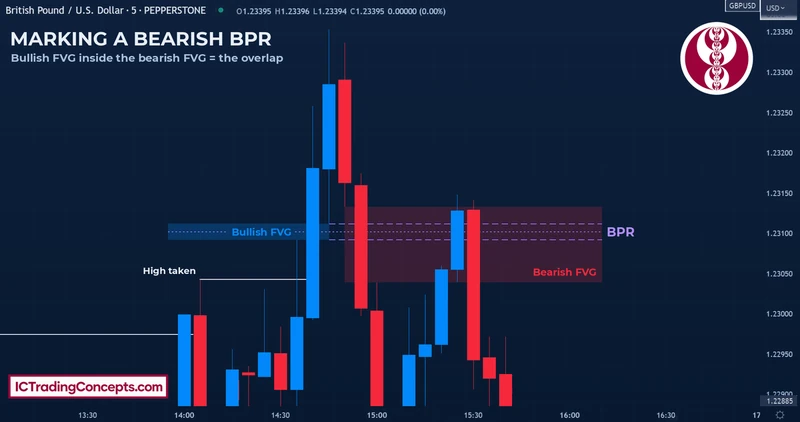
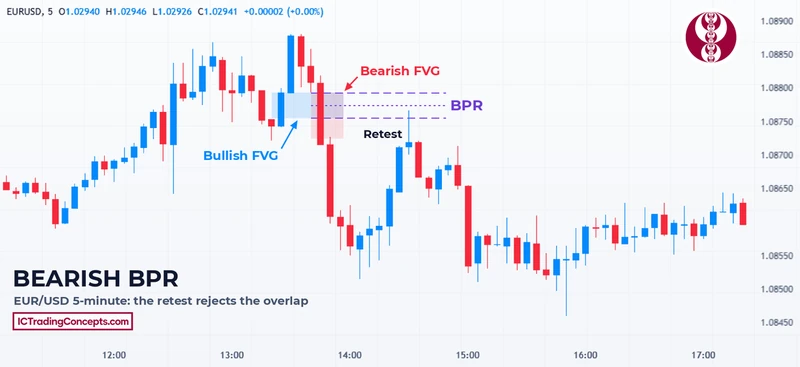
A bearish BPR is the mirror case. A rally leaves a bullish FVG, then a drop through it leaves a newer bearish FVG on top. After the drop, the BPR sits above price. Traders look for short entries on the retest, ideally in the premium half of the range.
How to Mark a BPR Correctly
Marking a balanced price range takes four steps. Each FVG is first marked the usual way, wick to wick.
- Mark the bearish FVG on the down-leg.
- Mark the bullish FVG on the up-leg.
- Check that the two gaps share prices. A near miss is not a BPR.
- Shade only the shared band. Its top is the lower of the two gap tops. Its bottom is the higher of the two gap bottoms.
Often one gap is much larger and surrounds the other. In that case the smaller gap is the whole BPR, because every price inside it belongs to both gaps. The middle of that band is the 50% level that traders use for limit entries.
The bearish case is marked the same way. The extremes of the larger gap are ignored. Only the band both gaps share is kept.
Why Price Reacts at a Balanced Price Range
Each FVG is a price range that was delivered in only one direction. At a balanced price range, two such ranges stack at one level, one from each side. When price returns, it reaches a level where both sides once moved price fast. The reaction there can be quick and sharp.


The V that often creates a BPR adds a second clue. A fast run into liquidity and a fast run back out suggest the move was a liquidity sweep, not the start of a new trend. Price then has less reason to return for the same liquidity.
None of this makes the reaction certain. It explains why the overlap gets more attention than a lone gap.
What Separates a Strong BPR From a Weak One?
Every balanced price range has the same anatomy, but not every one is worth trading. The difference lies in the context around it, not in the definition.
| Factor | Stronger BPR | Weaker BPR |
|---|---|---|
| Overlap | A clear shared band | A thin overlap that barely shares prices |
| The two legs | Displacement both ways, a sharp V | Slow, overlapping candles |
| Location | At a higher-timeframe PD array or right after a liquidity sweep | In the middle of a choppy range |
| Premium / discount | Bullish BPR in discount, bearish BPR in premium | Bullish BPR in premium, bearish BPR in discount |
| Bias | With the daily bias and the larger trend | Against the daily bias |
| Structure | The newer gap comes from the leg that shifts structure (MSS) | No shift in structure |
Overlapping gaps inside a choppy range are a common trap. Price trades back and forth there, so opposite FVGs overlap by accident. Without a PD array tap or a liquidity sweep, an overlap there is a weak setup.
Confluence With Other ICT Concepts
A balanced price range rarely works alone. These neighbours can add weight to it:
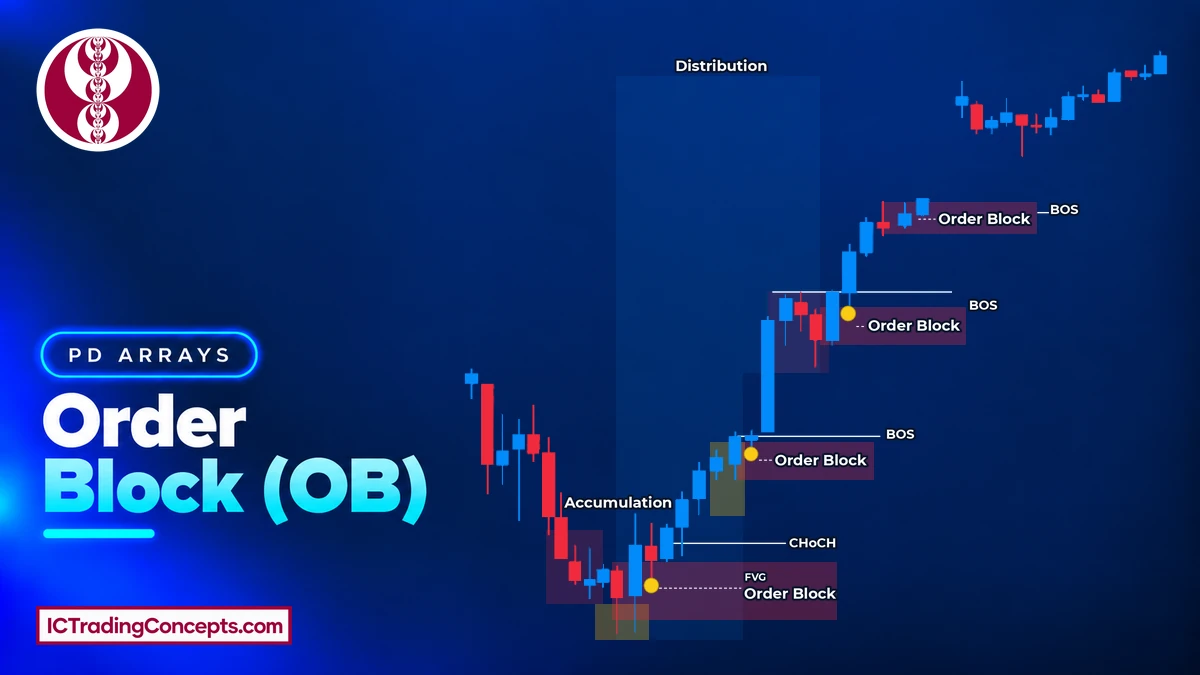
- Order block: an order block at or near the overlap can add to the zone's importance.
- Liquidity pool: resting stops just beyond the BPR may be run before price reacts.
- Market structure shift: an MSS on the lower timeframe confirms the turn that created the second gap.
- Other FVGs: gaps outside the BPR can act as extra zones of interest on the way.
- Higher-timeframe levels: a BPR inside a higher-timeframe PD array carries more weight than one in open space.
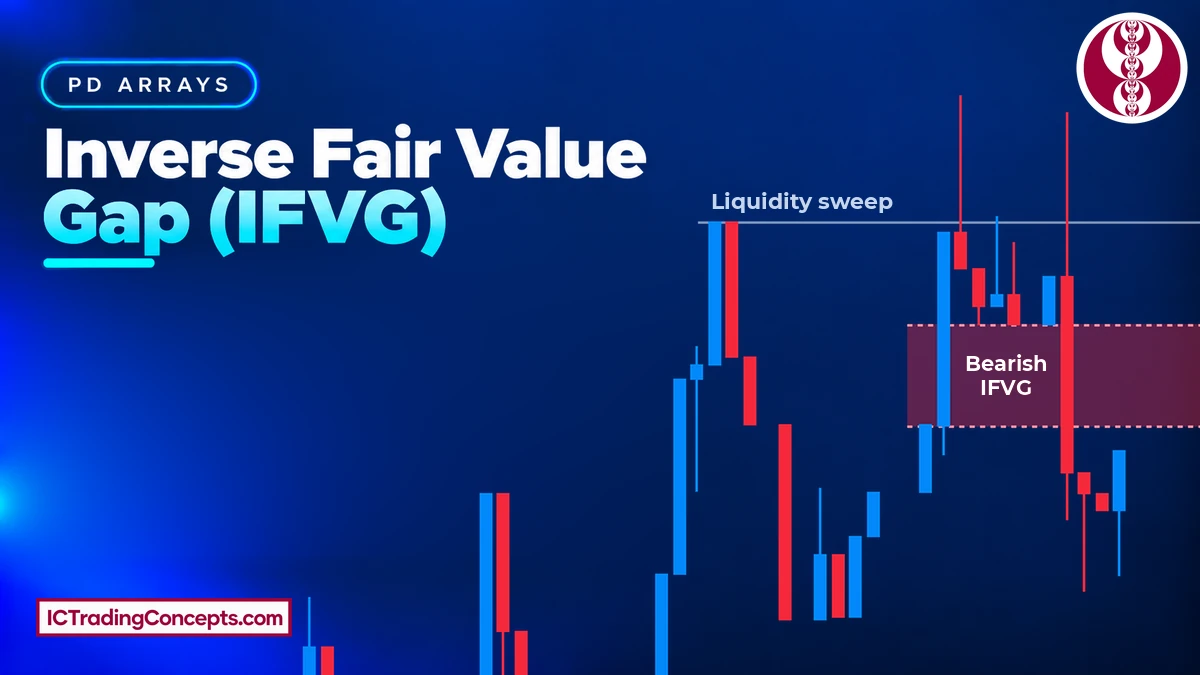
How a BPR Differs From a Single FVG and an IFVG
A BPR is built from FVGs, and its older gap gets traded through. That makes it easy to confuse with two neighbouring concepts. The table keeps them apart.
| FVG | IFVG | BPR | |
|---|---|---|---|
| What it is | One three-candle imbalance | One FVG that price closes through, then used the other way | The shared band of two opposite FVGs |
| Gaps needed | One | One, which failed | Two, one bullish and one bearish |
| Direction comes from | The move that created it | The move that broke through it | The newer gap |
| Entry zone | The gap, often its 50% level | The inverted gap | The overlap only |
A lone FVG offers more setups through the day. A BPR offers fewer, but entering on a single gap without the second, overlapping one is the lower-probability trade. An inverse fair value gap needs only one gap that failed. A BPR needs a new opposite gap that lands on top of the old one.
How Traders Use a Balanced Price Range
A BPR in trading is an entry zone, not a full strategy. Traders add it to the model they already use, as a filter that marks a cleaner entry.
A Simple Trade Flow, Step by Step
The flow below follows the usual ICT top-down sequence. Each step narrows the location, and the BPR is the last piece.
- Set the daily bias. BPR trades work best in its direction.
- Mark the higher-timeframe PD array on the daily, 4-hour or 1-hour chart.
- Wait for price to reach it. Do not pre-position.
- Drop to the 5-minute or 3-minute chart.
- Wait for a market structure shift in the direction of the bias. SMC traders often call this break a change of character (CHoCH).
- Mark the FVG of the displacement leg that caused the shift.
- Find the older opposite FVG at the same prices. The overlap is the BPR.
- Enter on the retest, or place a limit order at the 50% level of the overlap.
- Place the stop beyond the swing high (bearish) or swing low (bullish) before the shift, with a small buffer; in a sweep setup, that swing is the sweep's extreme.
- Target the next liquidity: equal highs or lows, or the higher-timeframe draw on liquidity.
A stop just one pip past the BPR is often hit by the retest spike. That is why the stop goes beyond the swing before the shift. Some traders also take partial profit near 2R or move the stop to break-even there.
In a bearish BPR, the entry sits in the overlap above price, and the target is the sell-side liquidity below. A bullish BPR mirrors it: the entry sits in the overlap below price, and the target is the buy-side liquidity above. In both cases, the stop goes beyond the swing high (bearish) or swing low (bullish) before the shift, with a small buffer; in a sweep setup, that swing is the sweep's extreme.


Which Timeframes and Markets Suit a BPR?
The balanced price range works on any timeframe. The mechanics stay the same; only the chart you mark the gaps on changes.
| Style | Charts to mark the BPR on |
|---|---|
| Scalping | 1-minute, 3-minute or 5-minute |
| Day trading | 15-minute and 5-minute |
| Swing trading | 4-hour and 1-hour |
Whatever the timeframe, read the higher timeframe first. A BPR that fights the larger trend is the one most likely to fail.
The overlap logic works in any liquid market. Most examples on this page are GBP/USD and EUR/USD on the 5-minute chart. The same mechanics apply to gold (XAU/USD) and to index futures such as the E-mini Nasdaq-100 (NQ) and the E-mini S&P 500 (ES).
Why Some Setups Still Fail
A balanced price range raises the quality of an entry. It does not guarantee the result. In one GBP/USD example, a bearish BPR met every condition: a sweep, a sharp V, a market structure shift and two overlapping gaps. Price still came back and hit the stop.
A stop moved to break-even at 2R would have closed that trade at break-even; partial profit near 2R would have kept part of the gain. Without either, it was a full loss. Keep these limits in mind:
- Marking can be subjective, especially when two traders use different timeframes.
- A lower-timeframe BPR can lose its meaning against the higher-timeframe context.
- Price can push through a BPR for a moment before it reverses.
- News releases and sudden volatility can override any zone.
Common Mistakes
Most failed BPR trades come from a short list of errors. Each one breaks a rule from the sections above.
- Marking a BPR without a real overlap. The two gaps must share prices. Gaps that only sit in the same area are not a BPR.
- Using two gaps in the same direction. Two stacked bullish FVGs are not a BPR. They are just a larger bullish imbalance.
- Treating the larger gap as the entry zone. The entry zone is the overlap only; when one gap sits inside the other, that is the smaller gap.
- Trading against the daily bias. BPRs that fight the bias fail more often than aligned ones.
- Placing the stop just past the BPR. Put it beyond the swing high (bearish) or swing low (bullish) before the shift, with a small buffer; in a sweep setup, that swing is the sweep's extreme.
- Forcing a BPR with no level nearby. Without a higher-timeframe PD array or a sweep, the overlap has little reason to hold.
Balanced Price Range Indicators on TradingView
Indicators can mark balanced price ranges automatically. They save marking time, but they do not read bias or location for you.
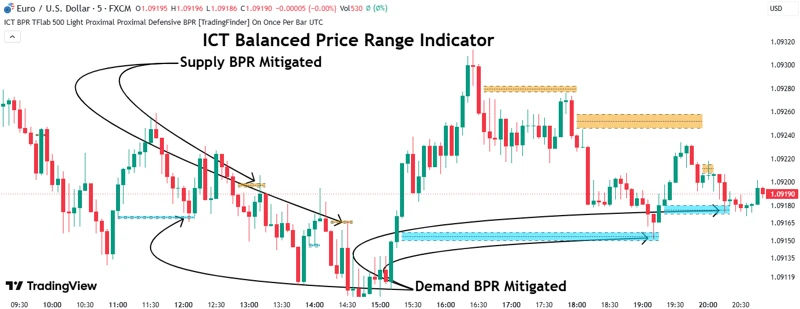
ICT Balanced Price Range [TradingFinder] BPR | FVG + IFVG
Finds two FVGs that oppose each other at the same prices and marks their overlap as a bullish or bearish BPR. It also flags when price returns to a zone.
View on TradingView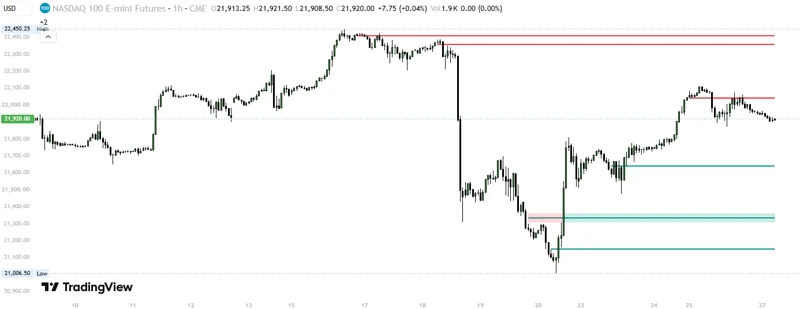
CandelaCharts - Balanced Price Range (BPR)
Draws the overlap of a sell-side FVG and a buy-side FVG as a BPR zone. Newer versions can filter the zones by bias.
View on TradingView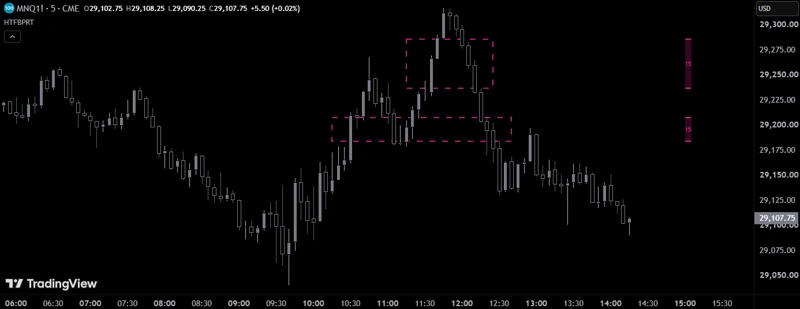
HTF BPR (Balanced Price Range)
Detects BPRs where a bullish and a bearish FVG overlap on a higher timeframe and plots them on the lower-timeframe chart, with markers when price touches a zone.
View on TradingViewTest Your Balanced Price Range (BPR) Knowledge
Eight quick questions on the overlap rule, the newer gap that sets direction, marking the shared band, the 50% entry and the stop. Each answer links back to the section that explains it.
ABCD Answer with your keyboard
-
01What exactly is a balanced price range (BPR)?
A BPR is only the band where one bullish and one bearish FVG cover the same prices. Two opposite gaps that do not touch are just two FVGs. Review: What Is a Balanced Price Range (BPR) in ICT?
-
02Which gap sets the direction of a BPR?
The newer gap names the direction. A newer bullish FVG over an older bearish FVG makes a bullish BPR. Review: How Does a Balanced Price Range Form?
-
03One FVG sits completely inside the other. What is the BPR?
Every price inside the smaller gap belongs to both gaps, so the smaller gap is the whole BPR. Review: How to Mark a BPR Correctly
-
04Two stacked bullish FVGs overlap. What do they form?
A BPR needs one bullish and one bearish FVG. Two stacked bullish FVGs are just a larger bullish imbalance. Review: Common Mistakes
-
05Where does the limit entry go in a BPR?
Entries use the overlap only: the retest, or a limit order at the overlap's 50% level. The 50% of the larger gap is not the BPR entry. Review: this section
-
06In a bearish BPR trade, where does the stop go?
A stop just past the BPR is often hit by the retest spike. It goes beyond the swing high before the shift; in a sweep setup, that swing is the sweep's extreme. Review: this section
-
07Which of these is part of the BPR definition itself?
Bias, a higher-timeframe PD array, a sweep and a structure shift are setup filters. The definition is only the overlap of two opposite FVGs. Review: What Separates a Strong BPR From a Weak One?
-
08How does a BPR differ from an IFVG?
An IFVG needs only one gap that price closed through. A BPR needs a new opposite gap that lands on top of the old one. Review: How a BPR Differs From a Single FVG and an IFVG
Review your answers
Conclusion
A balanced price range is a narrow idea with strict rules. Two opposite FVGs must truly overlap, the newer gap sets the direction, and only the shared band is traded. Bias, a higher-timeframe PD array and a structure shift help decide whether a given BPR is worth the risk; in the sweep-based setup, a liquidity sweep adds one more confirmation. Mark the overlap precisely and place the stop beyond the swing high (bearish) or swing low (bullish) before the shift, with a small buffer; in a sweep setup, that swing is the sweep's extreme. Even then, expect some valid BPRs to fail.
Sources
- Balanced price range examples on GBP/USD and EUR/USD (5-minute): Mulham Trading, YouTube
- Volatility (finance): Wikipedia
- Order book: Wikipedia
Be the first to share your thoughts on this article.