

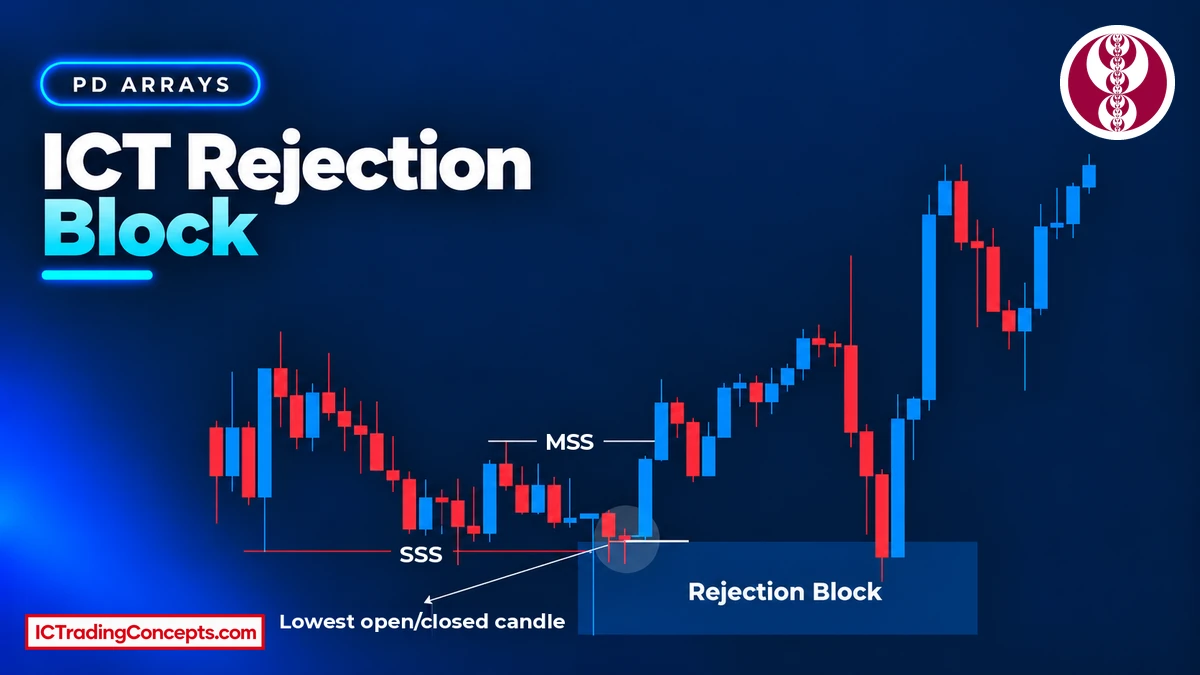
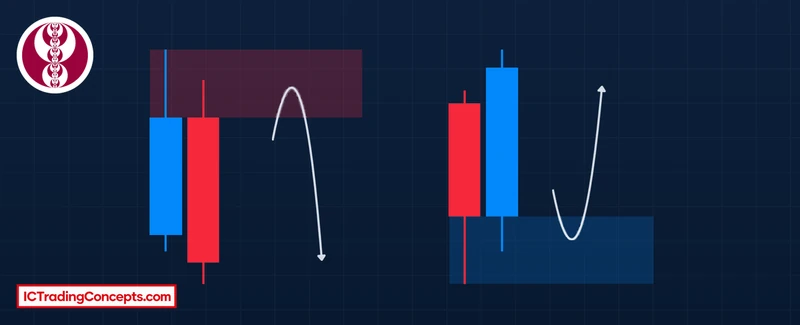
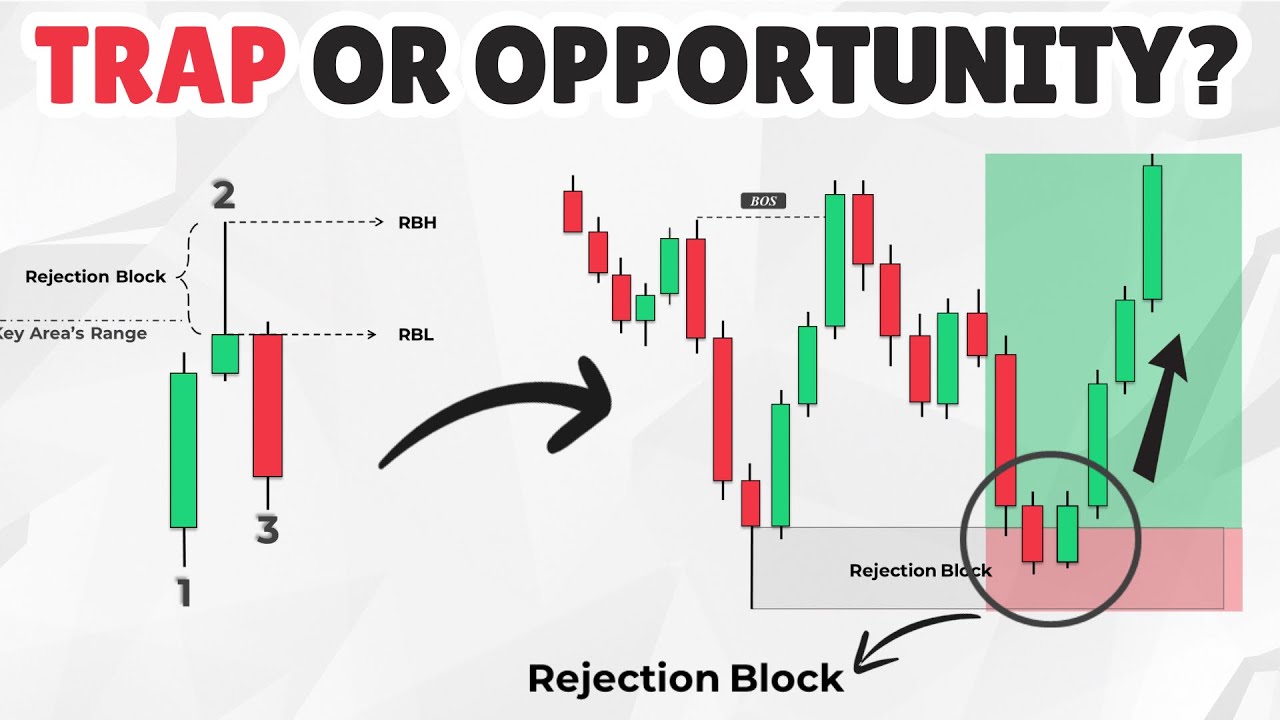
An ICT rejection block is the price zone left by the wick at a swing high or swing low, usually after price runs the liquidity beyond an old high or low and closes back inside the range. You mark it from the body edge to the wick extreme. When price returns, a bearish rejection block is watched as potential resistance and a bullish rejection block as potential support.
Key Takeaways
- A rejection block is built from the wick of the candle (or candles) that formed a swing high or low, not from the body.
- Mark it from the body edge nearest the wick to the wick extreme. The 50% level of that range is a common reference.
- It carries more weight when the wick swept liquidity and price displaced away with a market structure shift.
- A candle body that closes beyond the wick extreme invalidates the block.
What Is a Rejection Block in ICT?
A rejection block is one of the PD arrays taught by Michael J. Huddleston (ICT). The order block is built from a candle body. The rejection block is built from the wick: the part of the candle where price traded but could not hold.
It forms at a swing extreme. Price pushes beyond the candle bodies, often through an old high or low, triggers the orders resting there, then snaps back and closes inside the prior range. The wick left behind marks the prices the market refused. The zone between the body and the tip of that wick is the rejection block.
Keep the definition and the context apart:
- Definition: a wick zone at a swing high or low, marked from the body edge to the wick extreme.
- Context: a run on an old high or low, a wick that is large for its surroundings, and a structure shift afterward. These make a rejection block more useful, but they are not what defines it.
In practice, most rejection blocks worth marking form right after a liquidity sweep. A long wick in the middle of a range, with no old high or low taken, carries much less weight.
How Does a Rejection Block Form?
A rejection block is the footprint of a failed push. The sequence usually plays out within one to three candles:
- Run on liquidity. Price trades beyond the candle bodies, where stop orders and breakout orders rest. This run often takes out an old high or low, but price does not have to make a new high or low for a rejection block to form. A triggered stop order becomes a market order, and those orders supply the liquidity for the quick push.
- Rejection. Price fails to hold beyond the bodies and closes back inside the range, leaving a long wick.
- Displacement. The following candles move away from the extreme, often breaking a nearby swing point.
Bullish Rejection Block
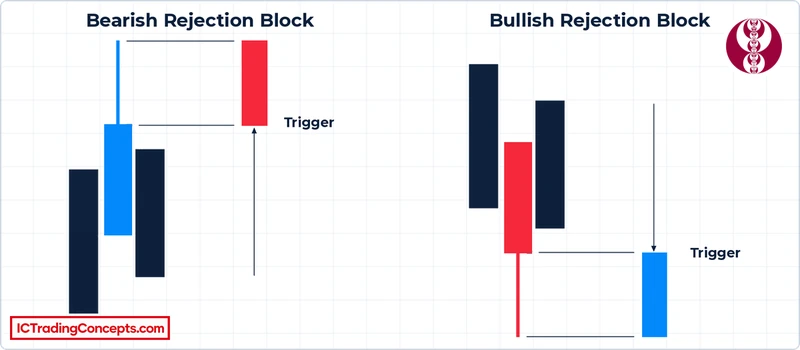
A bullish rejection block forms at a swing low. Price trades below the candle bodies, takes the sell-side liquidity resting there, and closes back up with a long lower wick. That run often goes through an old low or equal lows, but a new low is not required. The zone runs from the bottom of the body down to the wick low.
When price returns to that zone, it is watched as potential support for long setups. The reference invalidation sits below the wick low.
Bearish Rejection Block
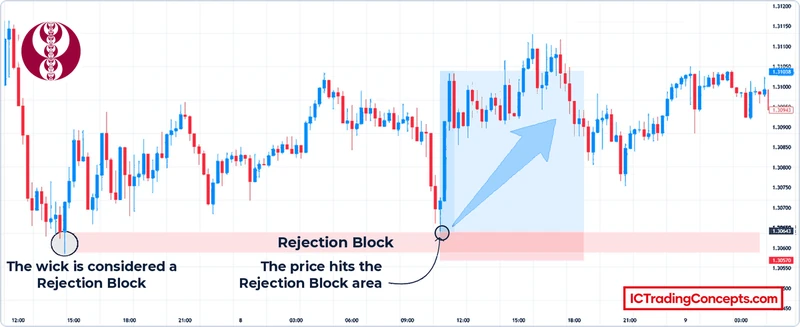
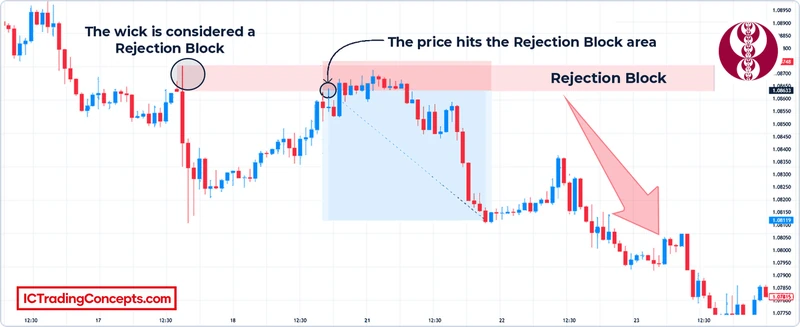
A bearish rejection block is the mirror image at a swing high. Price trades above the candle bodies, takes the buy-side liquidity, and closes back down with a long upper wick. That run often clears an old high or equal highs, but a new high is not required. The zone runs from the top of the body up to the wick high.


On the return, it is watched as potential resistance for short setups, with the reference invalidation above the wick high.
How to Identify and Mark a Rejection Block
Marking is where most rejection block errors start, because the zone is defined by the wick and one specific body edge, not by the whole candle.
- Find a swing high or low with a clearly long wick, ideally one that ran an old high, an old low, or equal highs or lows.
- Confirm that price closed back inside the range. The body should not accept beyond the level.
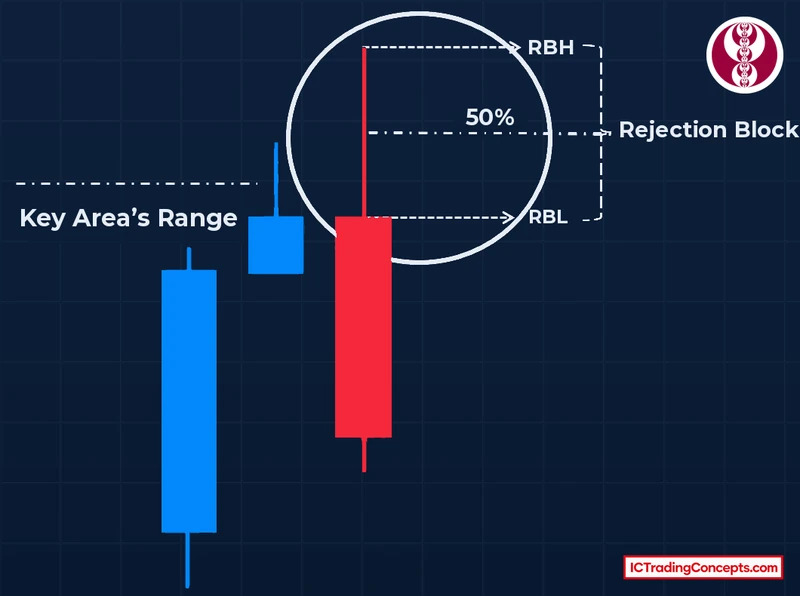
- Mark the body edge nearest the wick: the top of the body (the higher of open and close) for a bearish block, the bottom of the body for a bullish block.
- Extend the zone to the wick extreme: the high for a bearish block, the low for a bullish one.
- Add the 50% level of that range.
Several candles at the same extreme. When two or more candles form the swing point with long wicks, mark from the highest open or close in the swing to the highest wick. At a swing low, mark from the lowest open or close to the lowest wick.
This gives you two reference levels. The body edge is the first price inside the zone. Some traders place stops just beyond candle bodies instead of beyond the wick, and a widening bid-ask spread can trigger orders before the wick extreme itself is traded, so price does not always need to reach the tip. The 50% level of the wick range is a common entry reference. Which level you work from is a preference, not a rule.
Why Does Price React to a Rejection Block?
The wick is a record of prices the market tried and refused. When price comes back, the rejection block marks where that decision was made, which is why traders treat it as a reference rather than a random level.
- The fuel is gone. Much of the resting liquidity beyond the extreme was used up by the sweep, so there is less to drive price straight through on the return.
- Positions are trapped at the extreme. Breakout orders filled inside the wick were filled at the worst prices. A return into the zone gives those positions a chance to exit, which can add opposing orders at the same prices.
- Structure repeats on lower timeframes. Inside a higher-timeframe rejection block, the lower timeframe can show a smaller order block or a sweep followed by a structure shift, which gives a precise area to watch.
A reaction is a possibility, not a promise. The zone tells you where to pay attention; the price action on the return tells you whether the rejection is repeating.

Strong vs Weak Rejection Blocks
Not every long wick is worth marking. The context around the wick decides how much weight a rejection block deserves.
| Factor | Stronger rejection block | Weaker rejection block |
|---|---|---|
| Liquidity | The wick ran an old high or low, or equal highs or lows | The wick formed mid-range, with no clear liquidity taken |
| Wick size | Large compared with recent candles or the average true range (ATR) | Similar in size to the surrounding wicks |
| Reaction | Displacement away and a market structure shift | Slow drift, or price returns straight away |
| Location | Bearish block in premium, bullish block in discount, in line with higher-timeframe bias | Against the higher-timeframe bias |
| Confluence | Overlaps a fair value gap or another PD array | Isolated |
| Freshness | First return to the zone | Already revisited several times |
Start with the first three factors. A wick that took liquidity, stands out in size and was followed by a structure shift is a clear rejection; a small wick with none of these is usually just noise.
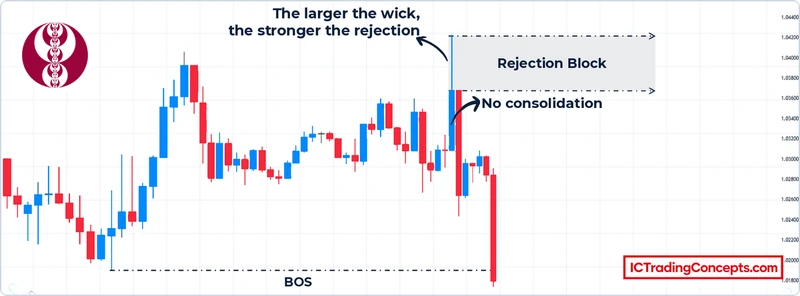
For a bullish rejection block, read the same factors from below: the long lower wick should run a prior low, and the move back up should leave an imbalance and shift structure above the last lower high.
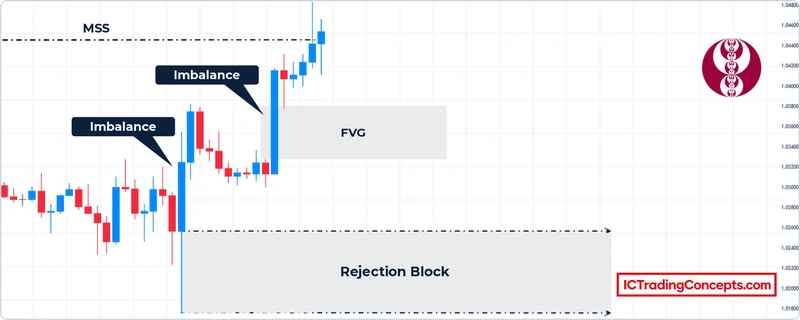
When Does a Rejection Block Fail?
A rejection block is invalidated when a candle body closes beyond the wick extreme. At that point the market has accepted the prices it refused before, and the zone no longer gives a reference.
Warning signs usually appear before that close:
- Price returns with strong displacement and moves through the body edge without slowing.
- The block points against the higher-timeframe bias.
- The old high or low beyond the wick is still the obvious target, so price may be heading for that liquidity rather than respecting the zone.
This is why stops go beyond the wick extreme and why a body close through the zone is the signal to remove it from the chart.
Rejection Block vs Order Block, Breaker Block and FVG
These four PD arrays often sit close together after a sweep and reversal, which is why they get mixed up. The difference is what each one is built from.
| PD array | Built from | Where it forms | Zone marked | Needs a failure first? |
|---|---|---|---|---|
| Rejection block | Wick (or wicks) at a swing extreme | Swing high or low, usually after a liquidity run | Body edge to wick extreme | No |
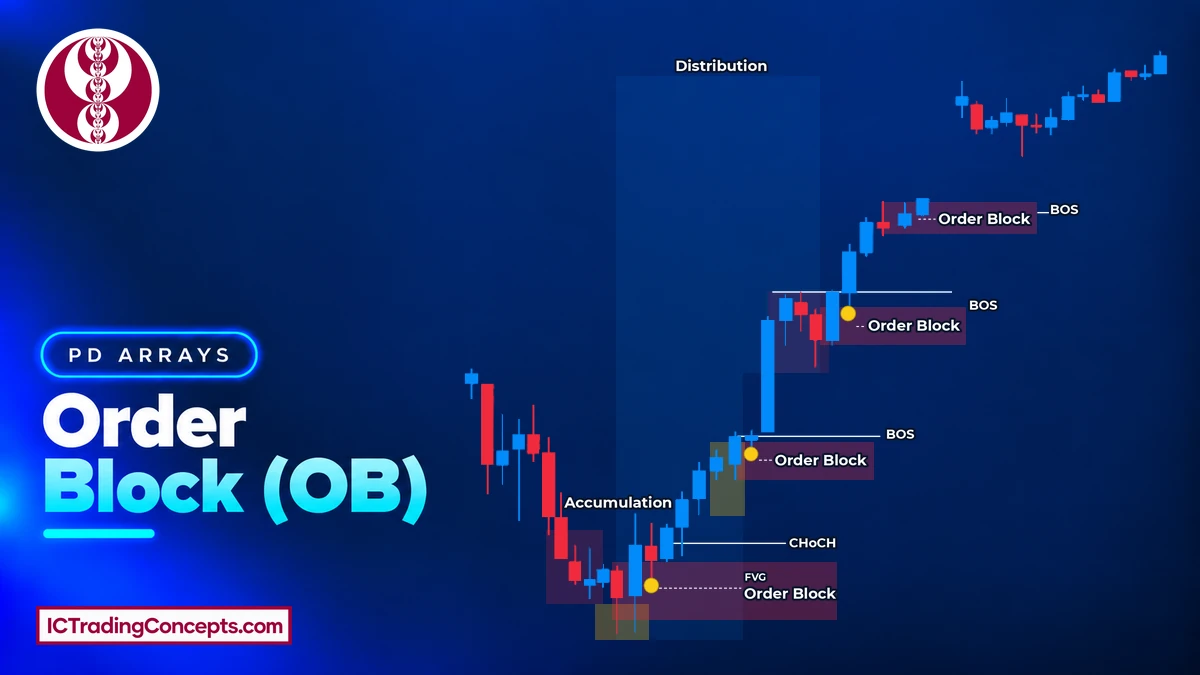
| Order block | Last opposite-direction candle before displacement | Origin of a move | That candle's body (some traders include the wicks) | No |
| Breaker block | A failed order block | After a sweep and a break of structure through it | The failed block's range | Yes, the original block must fail |
| Fair value gap (FVG) | Three-candle imbalance | Inside a displacement leg | Gap between candle 1 and candle 3 wicks | No |
For rejection block vs order block, the difference is anatomy. The order block uses the body at the origin of a move; the rejection block uses the wick at a refused extreme, which can give a tighter zone. The two can also nest: a higher-timeframe rejection block can contain a lower-timeframe order block.
How Traders Use Rejection Blocks
In practice, a rejection block is a location to wait at, not an entry signal on its own. A common flow looks like this:
- Mark the block on a higher timeframe (1-hour, 4-hour or daily) in the direction of your bias.
- Wait for price to return to the zone.
- Drop to a lower timeframe and look for confirmation inside or near the zone.
- Place the stop beyond the wick extreme, or beyond the lower-timeframe swing that confirms the entry.
- Target the opposing liquidity: the nearest swing high or low, or the higher-timeframe draw on liquidity.
Rejection blocks appear on every timeframe. A common pairing is a 1-hour to daily chart for the block and a 1-minute to 15-minute chart for the entry. Lower timeframes print more wicks, which means more blocks and more noise; higher-timeframe blocks are fewer and tend to carry more weight. There is no single best timeframe, only a trade-off between precision and frequency.

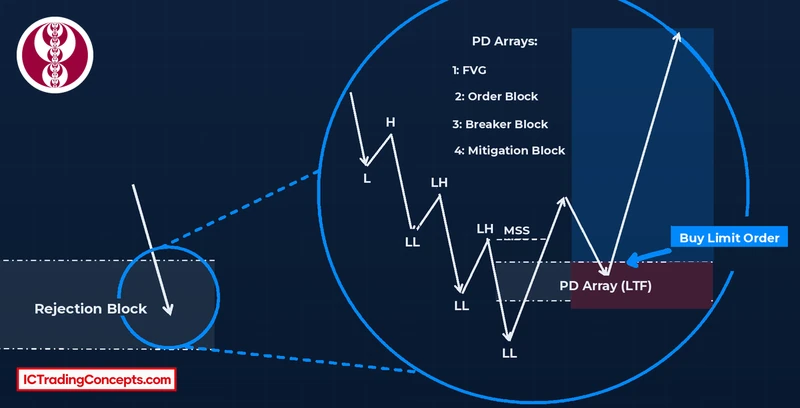
Confirming the Revisit on a Lower Timeframe
When price reaches the higher-timeframe block, the lower timeframe shows whether the rejection is repeating. The usual sequence: price taps the body edge or the 50% level, runs a minor lower-timeframe high or low, then breaks structure in the direction of the block.
That market structure shift usually leaves a fair value gap, an order block or a breaker block behind it, and that array becomes the entry. Without the shift, the touch is just a touch.
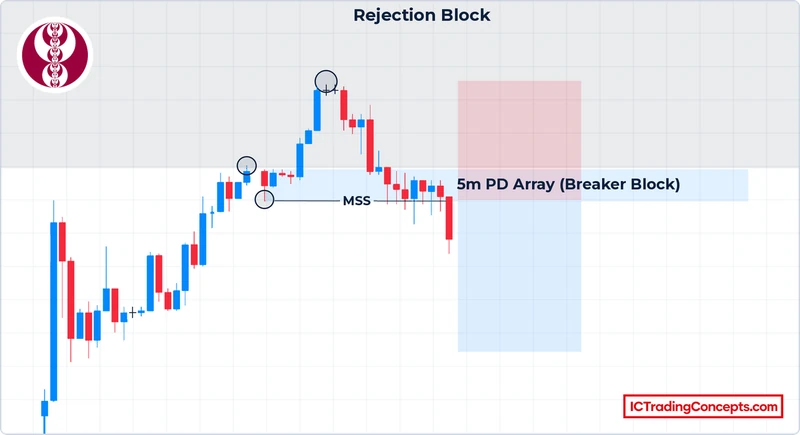
In a bearish block the sequence runs the other way: price rallies into the upper wick zone, takes a minor lower-timeframe high, then shifts structure lower on a chart such as the 5-minute. The short entry comes from the array that shift leaves behind, in this case a breaker block.
A Real Chart Example
In the video below, a bearish rejection block forms on a 30-minute EUR/USD chart after price takes the buy-side liquidity above a swing high and leaves a long upper wick. When price returns, the 5-minute chart shows the reaction starting near the 50% level, followed by a market structure shift and a bearish entry array, with sell-side liquidity as the target.
Common Mistakes
Most rejection block mistakes come from marking the wrong thing or trading the zone without context.
- Treating every long wick as a rejection block. Without a liquidity run or displacement, a long wick is often just noise.
- Marking the whole candle. The zone runs from the body edge to the wick extreme; the body itself is not part of it.
- Placing the stop inside the wick. A stop inside the zone can be taken by a normal retest. The reference invalidation is beyond the wick extreme.
- Trading the first touch against the bias. A block that points against the higher-timeframe bias has less behind it; wait for lower-timeframe confirmation.
- Keeping a block after a body close through it. Once a body closes beyond the wick extreme, remove the zone.
Rejection Block Indicators on TradingView
An indicator can scan past swing highs and lows and draw rejection blocks automatically, which saves time when reviewing many charts. It does not judge context, so the sweep, the bias and the structure still need your own check.
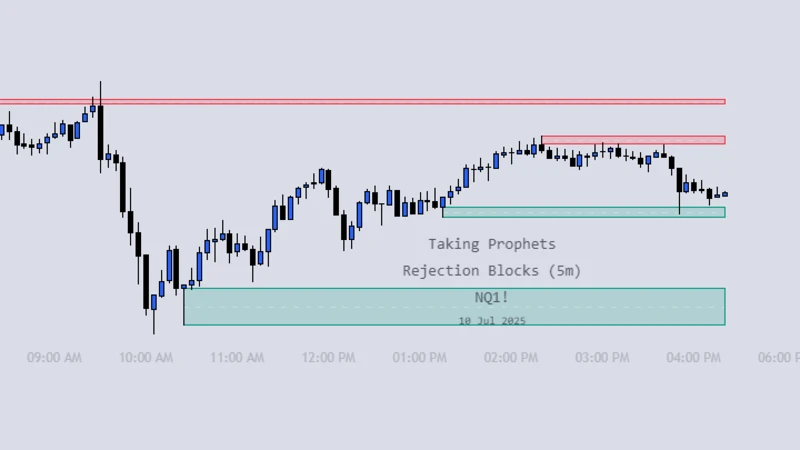
Rejection Blocks [Taking Prophets]
Marks bullish and bearish rejection blocks from candles with oversized wicks, extends them until they are invalidated and can plot the 50% midline.
View on TradingView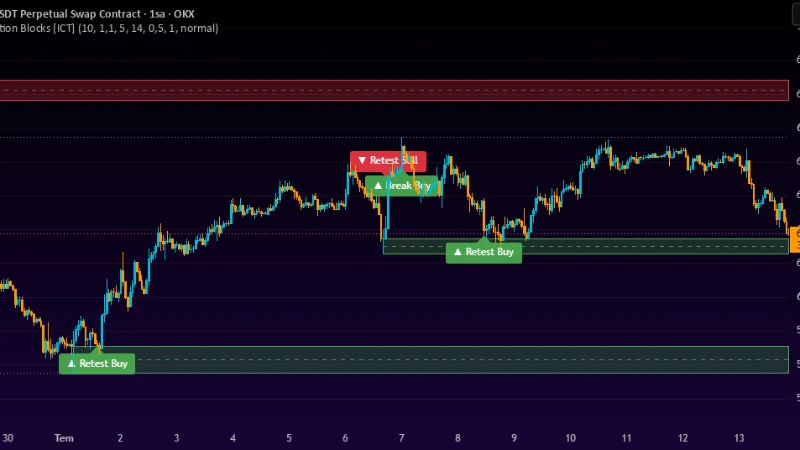
Rejection Blocks [ICT]
Detects rejection candles at swing highs and lows, filters out weak wicks by wick-to-body ratio and ATR distance, and can draw midpoint lines.
View on TradingView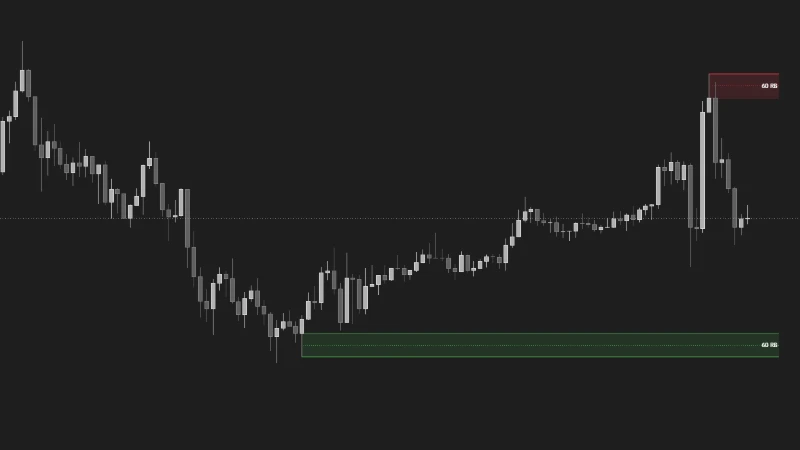
MTF Rejection Blocks
Plots the zone between the wick extreme and the body from up to three timeframes on one chart.
View on TradingViewTest Your ICT Rejection Block Knowledge
Eight quick questions on marking the wick zone, its strength, invalidation, look-alike PD arrays and the entry. Each answer links back to the section that explains it.
ABCD Answer with your keyboard
-
01Which part of the candle is a rejection block built from?
The rejection block uses the wick, the part where price traded but could not hold, marked from the body edge to the wick extreme. The last opposite candle's body is an order block, and the three-candle gap is an FVG. Review: What Is a Rejection Block in ICT?
-
02Where does a bearish rejection block start and end?
A bearish block is marked from the body edge nearest the wick, the top of the body, up to the wick high. The bullish block runs from the bottom of the body down to the wick low. Review: How to Identify and Mark a Rejection Block
-
03Two candles with long upper wicks form the same swing high. How is the bearish rejection block marked?
When several candles form the swing point, mark from the highest open or close in the swing to the highest wick. At a swing low, use the lowest open or close and the lowest wick. Review: How to Identify and Mark a Rejection Block
-
04Which detail makes a rejection block stronger?
A wick that took liquidity, stands out in size and was followed by a structure shift is a clear rejection. Mid-range wicks, ordinary-sized wicks and zones revisited many times carry less weight. Review: Strong vs Weak Rejection Blocks
-
05What invalidates a rejection block?
A body close beyond the wick extreme shows the market has accepted the prices it refused before, so the zone is removed. A touch of the 50% level or of the body edge is only a test. Review: this section
-
06What is the key difference between a rejection block and an order block?
The difference is anatomy: the order block uses the body at the origin of a move, and the rejection block uses the wick at a swing extreme, which can give a tighter zone. Only a breaker block needs a failed order block first. Review: Rejection Block vs Order Block, Breaker Block and FVG
-
07Where does the reference stop for a rejection block trade go?
The reference invalidation is beyond the wick extreme, or beyond the lower-timeframe swing that confirms the entry. A stop inside the zone can be taken by a normal retest. Review: Common Mistakes
-
08Price returns to a higher-timeframe rejection block. What confirms the entry on the lower timeframe?
On the return, the lower timeframe should run a minor high or low and then shift structure in the direction of the block. The FVG, order block or breaker it leaves becomes the entry; without the shift, the touch is just a touch. Review: this section
Review your answers
Conclusion
A rejection block is the wick zone at a swing high or low, marked from the body edge to the wick extreme. It works best as a location: a place where price already refused a set of prices and may do so again. The blocks worth marking usually swept liquidity, stand out in size and were followed by a structure shift. On the return, let the lower timeframe confirm the reaction, keep the stop beyond the wick extreme, and remove the block once a body closes through it.
Sources
- Bid-ask spread: Wikipedia
- Average true range: Wikipedia
- Rejection Blocks, the smart money trap and how to profit from it: Smart Risk, YouTube
- Every ICT PD array explained in 20 minutes: Mulham Trading, YouTube
- ICT Mentorship Core Content, Month 04, ICT Rejection Block: ICT, YouTube
Be the first to share your thoughts on this article.