

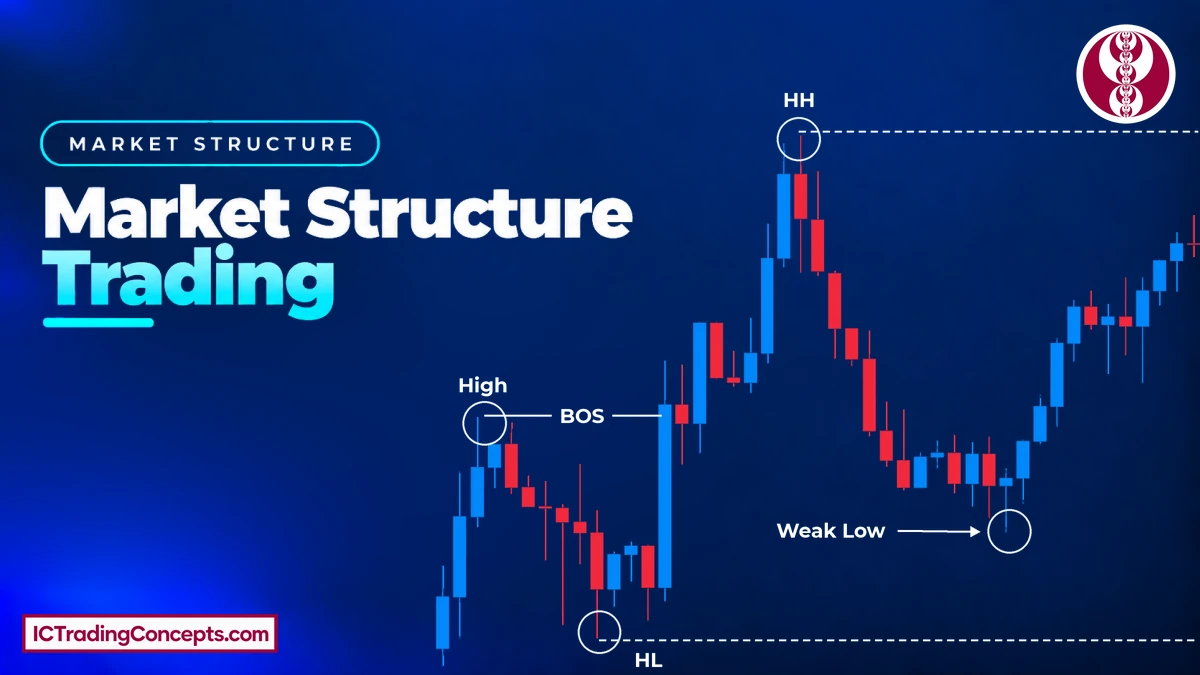
Market structure trading means reading a chart through its swing highs and swing lows to decide whether price is bullish, bearish or sideways. In Smart Money Concepts (SMC) and ICT, a bullish market structure prints higher highs (HH) and higher lows (HL). A bearish one prints lower highs (LH) and lower lows (LL). A structure break counts only when a candle body closes beyond a swing, on the timeframe you use to mark structure.
Key Takeaways
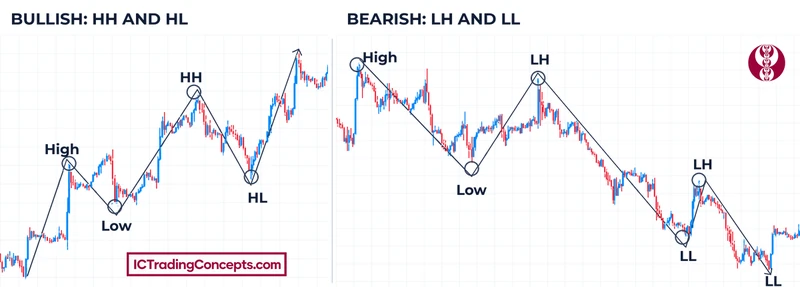
- Market structure is the sequence of swing highs and swing lows. HH and HL make a bullish structure, LH and LL a bearish one, and a sideways market holds between one swing high and one swing low.
- A break counts only on a candle body close beyond the swing, on your structure timeframe. A wick through the swing that closes back inside is a liquidity sweep.
- Mark external swings only. Internal swings inside a pullback are noise on that timeframe.
- A BOS confirms that the trend continues. A CHoCH is the first warning against it, and a BOS in the new direction confirms the change.
- The higher timeframe sets the direction. A lower-timeframe break against it is usually a pullback.
What Is Market Structure in Trading?
Market structure is the sequence of swing highs and swing lows that price leaves on a chart. It shows whether the market is trending up, trending down or moving sideways, and which side holds control. This page covers market structure as ICT and SMC traders read it, not market structure in economics.
The building blocks are swing points. On a candlestick chart, a swing high is a three-candle pattern whose middle candle has a higher high than the candles on both sides. A swing low is the mirror image: its middle candle has a lower low than its neighbors. Each new swing is compared with the previous swing of the same kind:
- Higher high (HH): a swing high above the previous swing high.
- Higher low (HL): a swing low above the previous swing low.
- Lower high (LH): a swing high below the previous swing high.
- Lower low (LL): a swing low below the previous swing low.
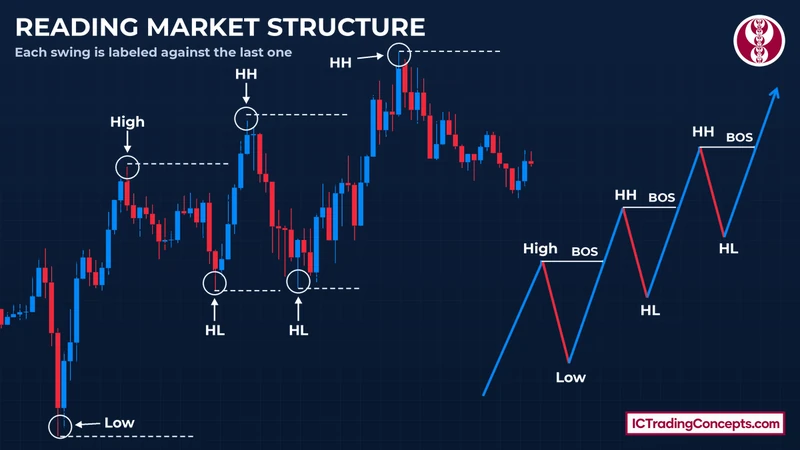
Market structure trading is the base layer of ICT and SMC analysis. Order blocks, fair value gaps and liquidity levels are all read inside it, so a wrong structure read leads to a wrong setup.
How Does Market Structure Form?
Price does not move in a straight line. It pushes in one direction, pulls back and pushes again, and every turn leaves a swing high or a swing low. The order of those swings puts the chart into one of three types:
| Market structure | Swing sequence | Side in control | What would change it |
|---|---|---|---|
| Bullish | Higher highs and higher lows | Buyers | A body close below the protected higher low |
| Bearish | Lower highs and lower lows | Sellers | A body close above the protected lower high |
| Sideways | One swing high and one swing low hold | Neither | A body close beyond the range high or low |
Bullish Market Structure
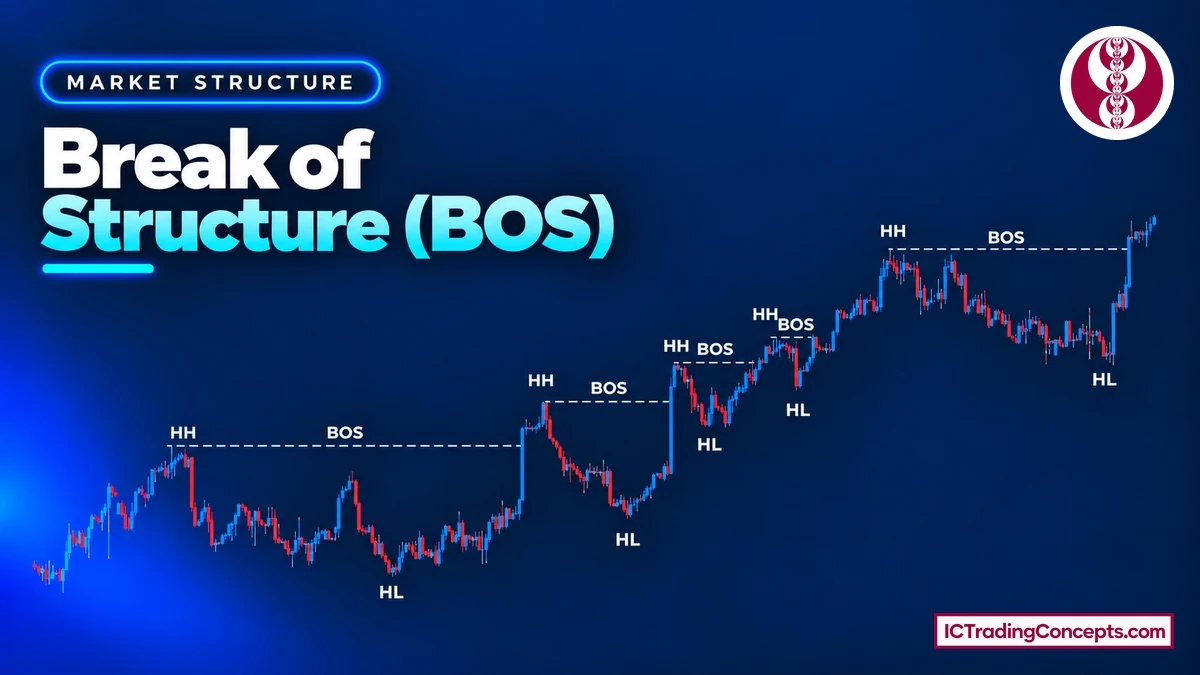
In a bullish market structure, price makes higher highs and higher lows. Each push closes above the previous swing high, and each pullback holds above the previous swing low. Buyers are in control.
The swing that matters most is the higher low that produced the latest higher high (the last BOS). It is the strong, or protected, low. As long as no candle body closes below it, the bullish structure is intact. The latest high is the weak high: the level the next push is expected to take out.


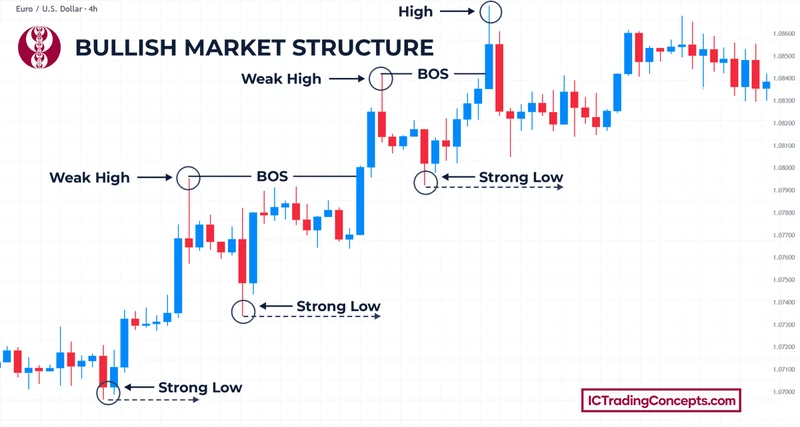
In a bullish structure, ICT and SMC traders look for long setups on pullbacks instead of selling each new high.
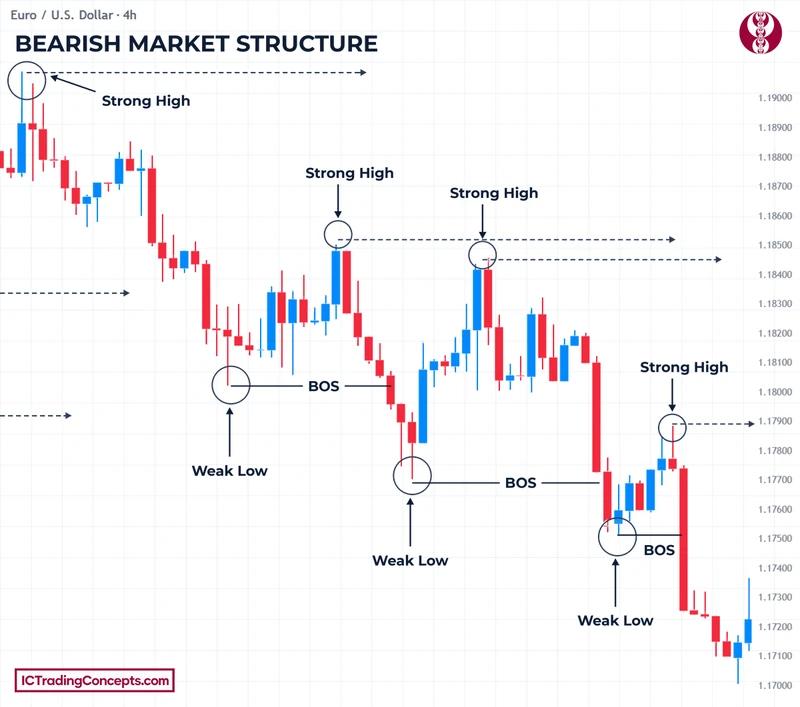
Bearish Market Structure
In a bearish market structure, price makes lower highs and lower lows. Each drop closes below the previous swing low, and each rally stays below the previous swing high. Sellers are in control.
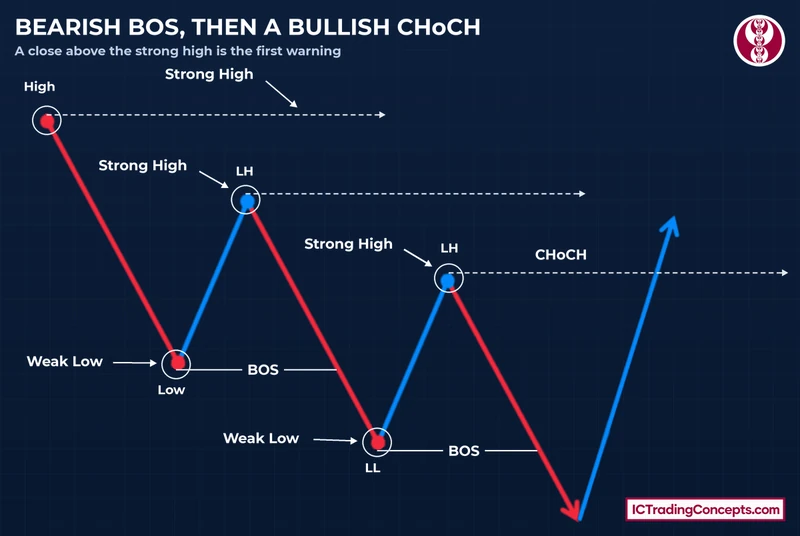
Here the key level is the lower high that produced the latest lower low (the last BOS): the strong high. Until a candle body closes above it, the bearish structure holds. The latest low is the weak low, and the next drop is expected to take it out. In a bearish structure, traders favor short setups on rallies.
Sideways Market Structure
A sideways market structure, also called a range, forms when price is held between one swing high and one swing low. Neither side makes a higher high or a lower low that holds on a close, so there is no trend.
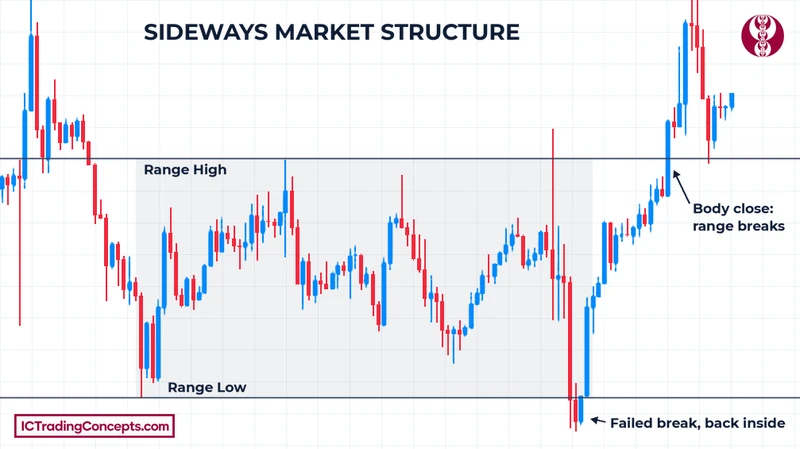
Without a trend there is no character to change, so a break inside a range is not a CHoCH. Price can trade above the range high or below the range low with a wick and close back inside. That wick takes liquidity without shifting the structure. Price can also close just below the range low and come straight back inside. That break failed: the body close broke the low, but price did not stay below it. It took the liquidity under the low, and the range stays in place. Direction returns only when a candle body closes beyond one side of the range and price holds there, and many traders wait for that close before taking a directional trade.


How to Mark Market Structure Correctly
Most market structure errors come from marking the wrong swings, not from missing the break. Work through these steps on one chart:
- Pick one structure timeframe, for example the 15-minute chart, and read every swing and every close there.
- Mark the external swing highs and swing lows, the ones that define the trend. Leave out the small swings inside each pullback.
- Label each swing against the previous one of the same kind: HH or LH for highs, HL or LL for lows.
- Find the two swings that matter now: the strong (protected) swing the trend relies on, and the weak swing the trend is expected to take next. A newer higher low that has not produced a BOS yet is not the strong low.
- Wait for a candle body close beyond one of them, then update the labels.
What Counts as a Market Structure Break: Body Close or Wick?
A market structure break counts only when a candle body closes beyond the swing, on the timeframe you used to mark structure. A 15-minute structure needs a 15-minute close. A spike on a lower timeframe does not decide it.
A wick that trades through the swing and closes back inside is not a break. It is a liquidity sweep: price takes the stop orders resting beyond the swing and then returns. The swing stays in place, and so does the structure.
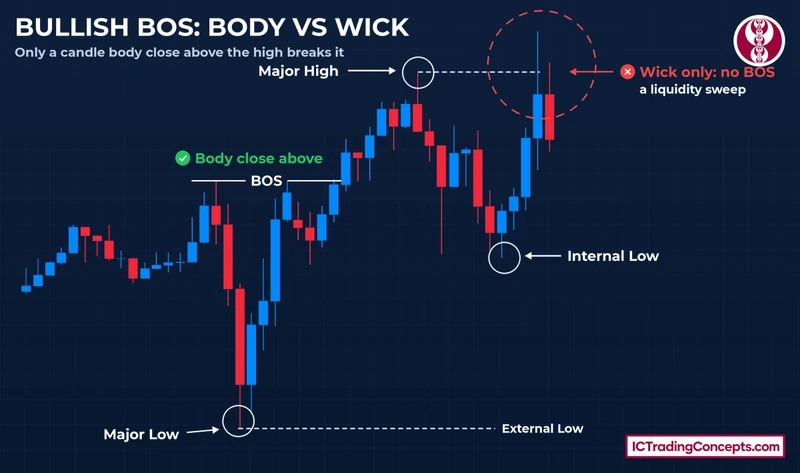
The bearish side mirrors this. A wick below the swing low that closes back above it changes nothing. A body close below it is the break.
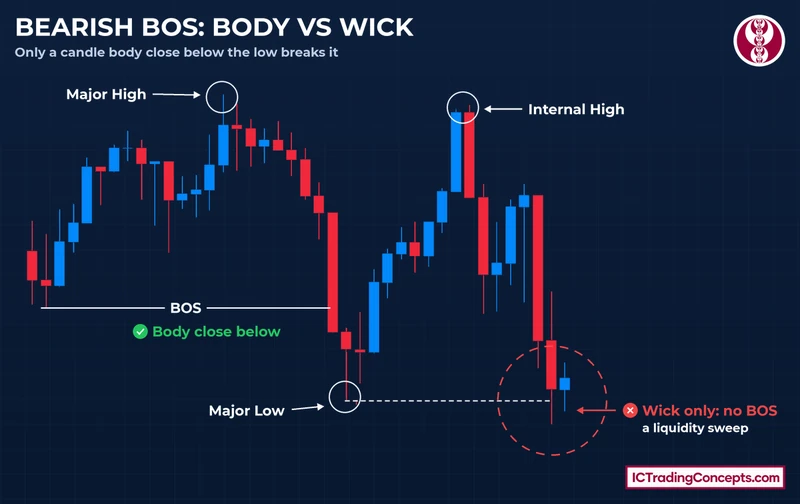
The direction of that close decides whether it is a break of structure (BOS) or a change of character (CHoCH).
External vs Internal Structure: Which Swings Count?
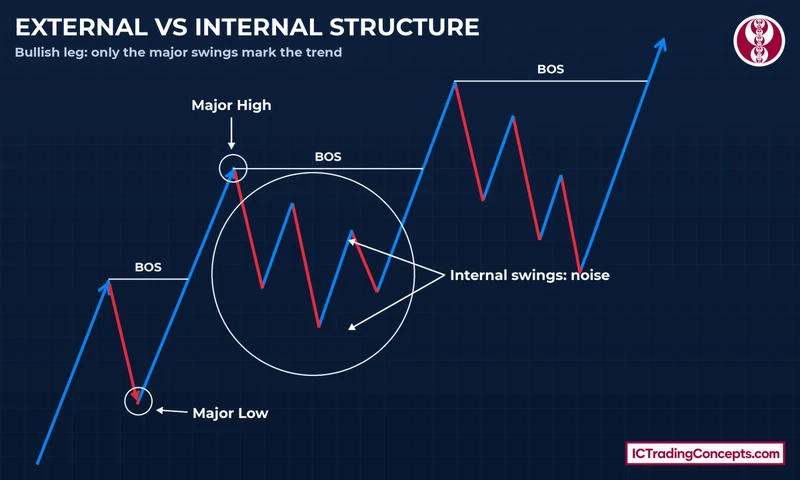
Every timeframe has two sets of swings. External swings are the major highs and lows that define the trend on that chart. Internal swings are the smaller highs and lows that form inside a pullback or a consolidation between them.
Only external swings count for structure. On your structure timeframe, a break of an internal swing is noise: it is neither a BOS nor a CHoCH. As long as the external lows hold in a bullish structure, buyers stay in control, whatever the internal swings do.
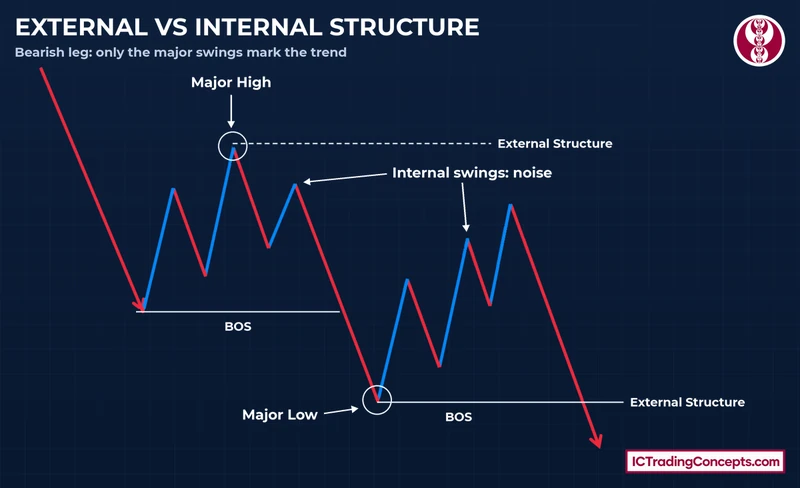
In a bearish structure the roles flip. The major high and the major low frame the leg, and the bounces between them are internal. Only a close below the external low is the next bearish BOS. ICT ranks swings in a similar way, as short-term, intermediate-term and long-term highs and lows (STH, ITH, LTH).
Why Market Structure Matters in ICT and SMC
Market structure answers the first question in any ICT or SMC setup: which direction should the trade take? It gives a trader three practical things:

- Direction: a bullish structure favors longs, a bearish structure favors shorts, and a range favors waiting.
- An invalidation level: the strong swing. If a body closes beyond it, the read has changed.
- Context for other concepts: an order block, a fair value gap or a liquidity sweep carries more weight when it lines up with the structure.
The logic behind the swings is liquidity. Stop orders collect beyond obvious swing highs and lows. When a trend continues, price takes the stops beyond the weak swing and closes through it. When a body closes through the strong swing instead, the side that held the trend has lost its level. Structure does not predict how far price will travel. It shows which side is in control until a close proves otherwise.
How Market Structure Continues or Reverses: BOS, CHoCH and MSS
After every swing, a trend either breaks again in its own direction or breaks against itself. SMC uses two labels for those events:
- BOS: a body close beyond the weak swing in the trend's direction, such as a close above the latest high in a bullish structure. It confirms continuation, but it is not an entry or exit signal on its own.
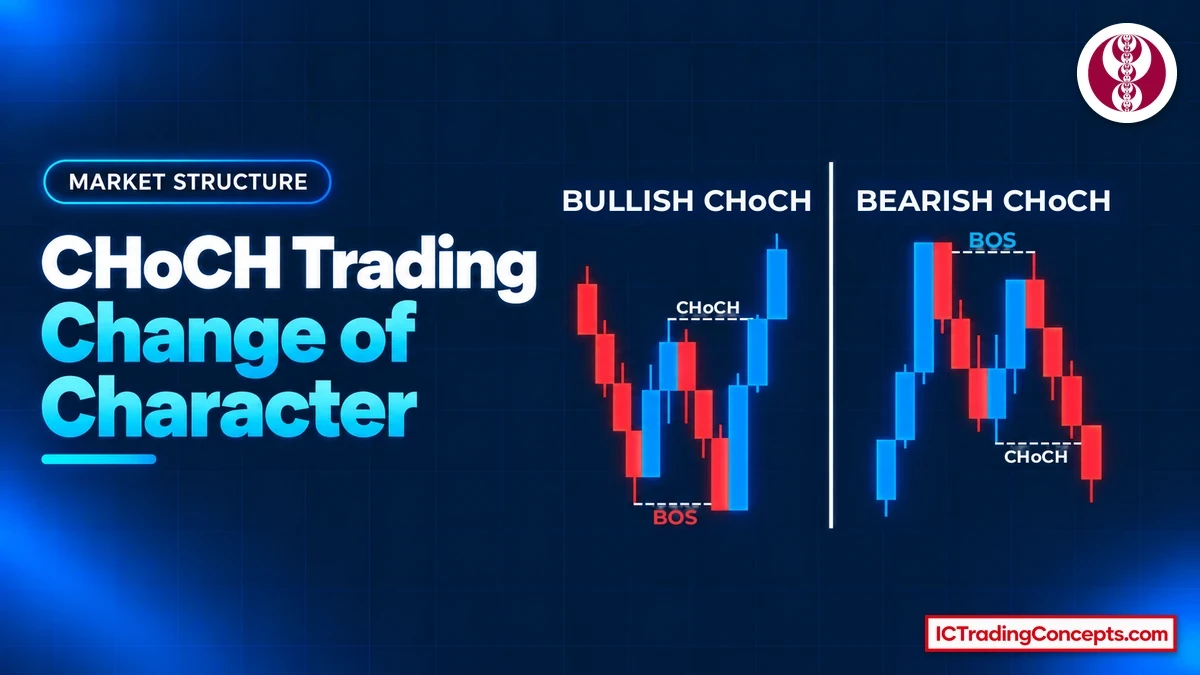
- CHoCH: the first body close against the trend, beyond the strong swing, such as a close below the protected higher low in a bullish structure. It is an early warning, not a confirmed reversal.
In ICT market structure, a similar break against the trend is called a market structure shift (MSS). On this site an MSS also needs displacement, so its closest SMC match is a CHoCH made with clear displacement.
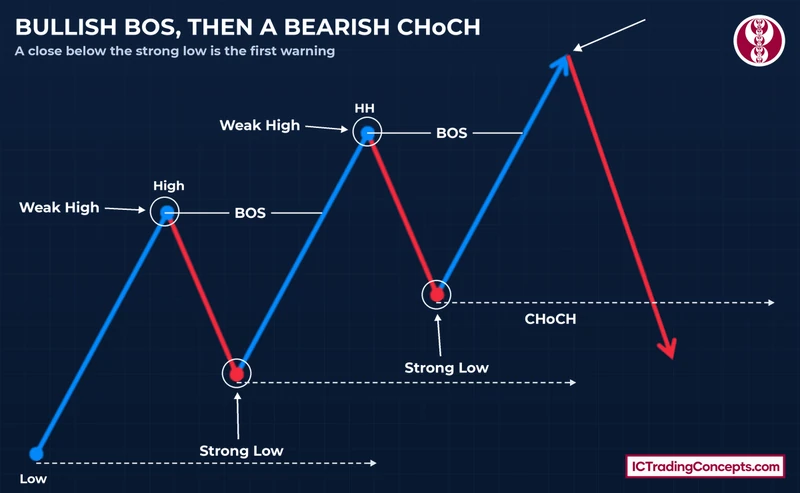
The events often appear in sequence. A run of BOS prints keeps the trend in place, and the first CHoCH puts it in doubt. A BOS in the new direction confirms the change. If price instead closes back beyond the broken level and prints a BOS in the old direction, the CHoCH has failed.
Reading Market Structure Across Timeframes
Market structure exists on every timeframe, and two timeframes can disagree. A daily chart can be bullish while the 15-minute chart is bearish, because the 15-minute chart is printing the daily pullback.
The working rule is simple. The higher timeframe sets the direction, and a lower-timeframe break against it is usually a pullback, not a reversal. There is no single best timeframe for market structure trading, but a common split looks like this:


| Role | Common charts | What it answers |
|---|---|---|
| Higher timeframe | Daily, 4-hour | Which direction to favor |
| Structure timeframe | 30-minute, 15-minute or 5-minute | Where BOS and CHoCH print, on body closes |
| Entry timeframe | One step below the structure chart | When the pullback has ended |
How Traders Use Market Structure in Practice
In practice, market structure trading is a filter and a map, not a complete strategy. A common ICT and SMC sequence uses it like this:
- Read the higher-timeframe structure and note its direction.
- Wait for a pullback against that direction.
- On the structure timeframe, wait for a CHoCH back in the higher-timeframe direction.
- Enter on the pullback into the order block or fair value gap left by that move, timed on the entry timeframe.
- Place the stop beyond the swing that started the move.
- Target the opposite liquidity, such as the previous high for a long or the previous low for a short.
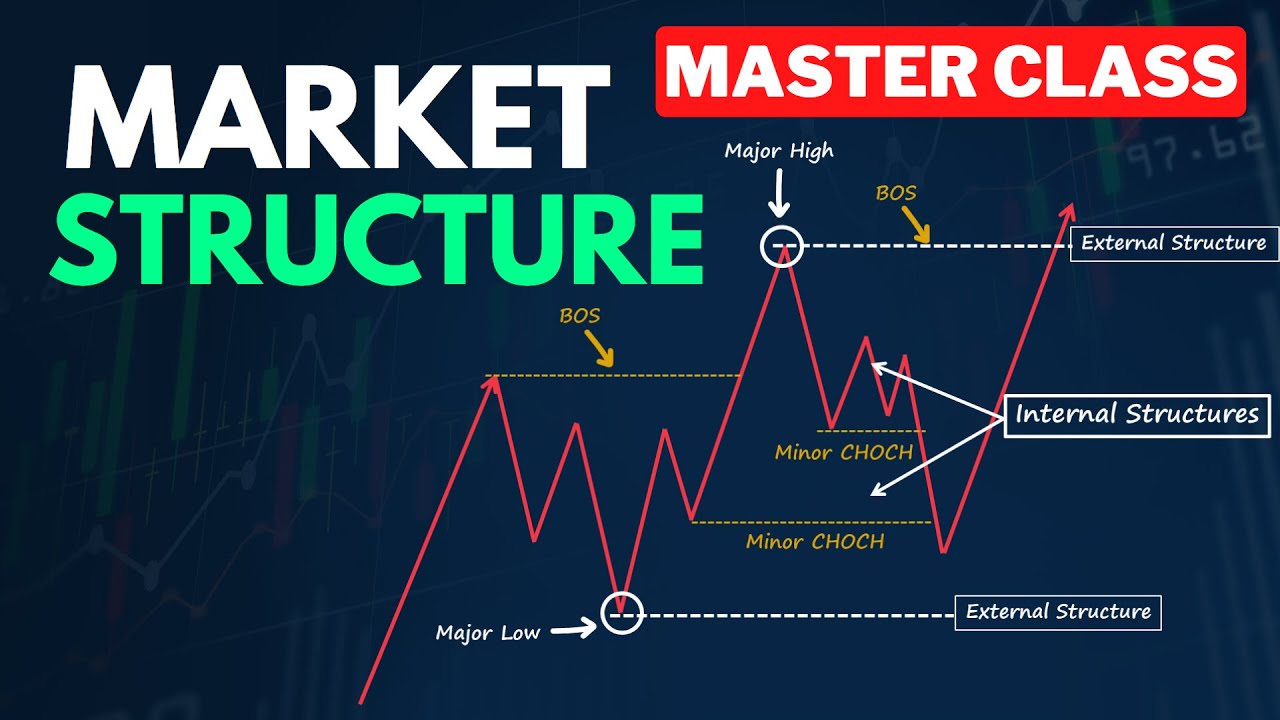
There is no fixed reward-to-risk in this sequence, and structure alone does not choose the entry. The video below walks through ideal and realistic market structure, bullish and bearish BOS, and CHoCH tips.
Common Mistakes
Most market structure trading mistakes come from reading the wrong swing or the wrong close. These six come up again and again:
- Reading only one timeframe. A 15-minute read without the daily chart can put a trade against the bigger trend. Check the higher timeframe first.
- Counting a wick as a break. A wick through the swing that closes back inside is a liquidity sweep. Wait for the body close.
- Marking internal swings as structure. Small swings inside a pullback do not count. Mark external highs and lows only.
- Mixing up BOS and CHoCH. A close beyond the weak swing, with the trend, is a BOS. The first close beyond the strong swing, against the trend, is a CHoCH. Swapping them flips the read.
- Treating a CHoCH as a confirmed reversal. It is an early warning. Wait for a BOS in the new direction before treating the reversal as real.
- Looking for a trend inside a range. A sideways structure has no trend, so it has no CHoCH. Wait for a body close beyond the range.
Market Structure Indicators on TradingView
Indicators can label swings, BOS and CHoCH for you, which saves time when you review many charts. Each tool uses fixed swing settings, so check that every label sits on an external swing and that the candle closed beyond it with its body.
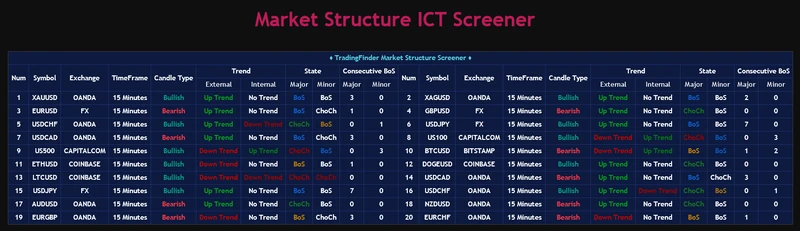
Market Structure ICT Screener [TradingFinder] BoS ChoCh
An open-source screener that checks up to 20 symbols and timeframes at once. One table shows, for major and minor structure, whether the last event was a BOS or a CHoCH. Use it to shortlist charts, then confirm the swing and the body close on the chart itself.
View on TradingView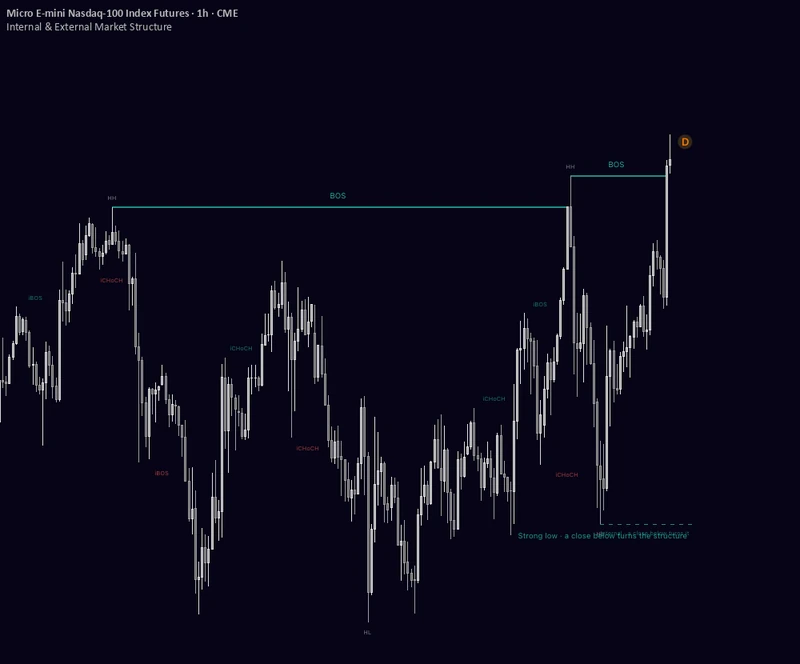
Internal & External Market Structure
An open-source script by Davidgorban that keeps external and internal structure apart: BOS and CHoCH for external swings, iBOS and iCHoCH for internal ones, plus HH, HL, LH and LL labels. It confirms breaks on closes only and treats a wick that closes back inside as a liquidity sweep.
View on TradingView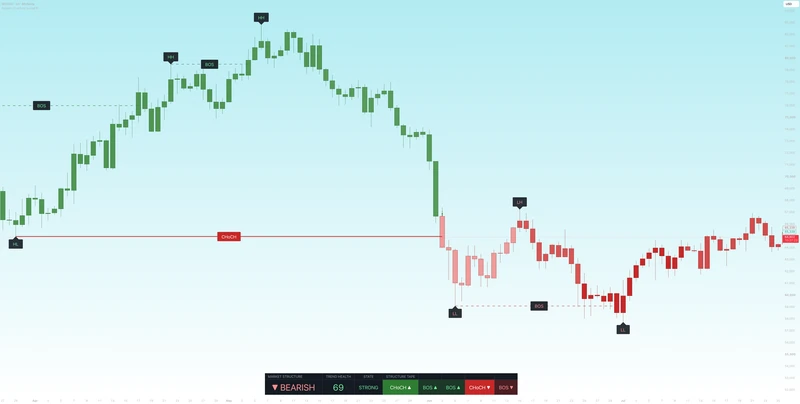
Market Structure BOS, CHoCH, HH HL LH LL & Trend Health [LunqFX]
An open-source script that labels swing highs and lows, marks BOS and CHoCH on candle closes by default, and adds a small panel with the current structure, its state and a trend-health score.
View on TradingViewTest Your Market Structure Trading Knowledge
Eight questions on body-close breaks, strong and weak swings, external versus internal structure, BOS and CHoCH, ranges, timeframes and the practical entry sequence. Each answer links back to the section that explains it.
ABCD Answer with your keyboard
-
01What counts as a market structure break?
Only a body close beyond the swing, on the timeframe used to mark structure, is a break. A wick that closes back inside is a liquidity sweep. Review: What Counts as a Market Structure Break: Body Close or Wick?
-
02In an uptrend, which low is the strong (protected) low?
The strong low is the higher low that produced the latest higher high. A newer higher low that has not produced a BOS yet is not the strong low. Review: How to Mark Market Structure Correctly
-
03What does a BOS tell you in a trend?
A BOS confirms continuation. It is not an entry or exit signal on its own. Review: How Market Structure Continues or Reverses: BOS, CHoCH and MSS
-
04After a CHoCH, what confirms that the trend has changed?
A CHoCH is the first warning against the trend. A BOS in the new direction confirms the change. Review: How Market Structure Continues or Reverses: BOS, CHoCH and MSS
-
05How should internal swings inside a pullback be treated?
Only external swings count for structure. Internal swings inside a pullback are noise on that timeframe. Review: External vs Internal Structure: Which Swings Count?
-
06Why is there no CHoCH inside a sideways market?
A range has no trend, so a break inside it is not a CHoCH. Direction returns when a body closes beyond one side and price holds there. Review: Sideways Market Structure
-
07Which timeframe sets the direction to favor?
The higher timeframe sets the direction. A lower-timeframe break against it is usually a pullback. Review: Reading Market Structure Across Timeframes
-
08After a CHoCH on the structure timeframe back in the higher-timeframe direction, where does the entry come?
The entry comes on the pullback into the order block or FVG. The stop goes beyond the swing, and the target is the opposite liquidity. Review: How Traders Use Market Structure in Practice
Review your answers
Conclusion
Market structure trading reduces a chart to its swings. A bullish structure prints higher highs and higher lows, a bearish one prints lower highs and lower lows, and a sideways market holds a range. Mark external swings on one timeframe, count only body closes and let the higher timeframe set the direction. A BOS keeps the trend, a CHoCH warns against it, and a BOS in the new direction confirms the change.
Sources
- Candlestick chart: Wikipedia
- Video tutorial on ideal and realistic swings, BOS and CHoCH: Smart Risk, YouTube
- Beginner structure examples on EUR/USD 4-hour charts: Smart Risk, YouTube
Be the first to share your thoughts on this article.