

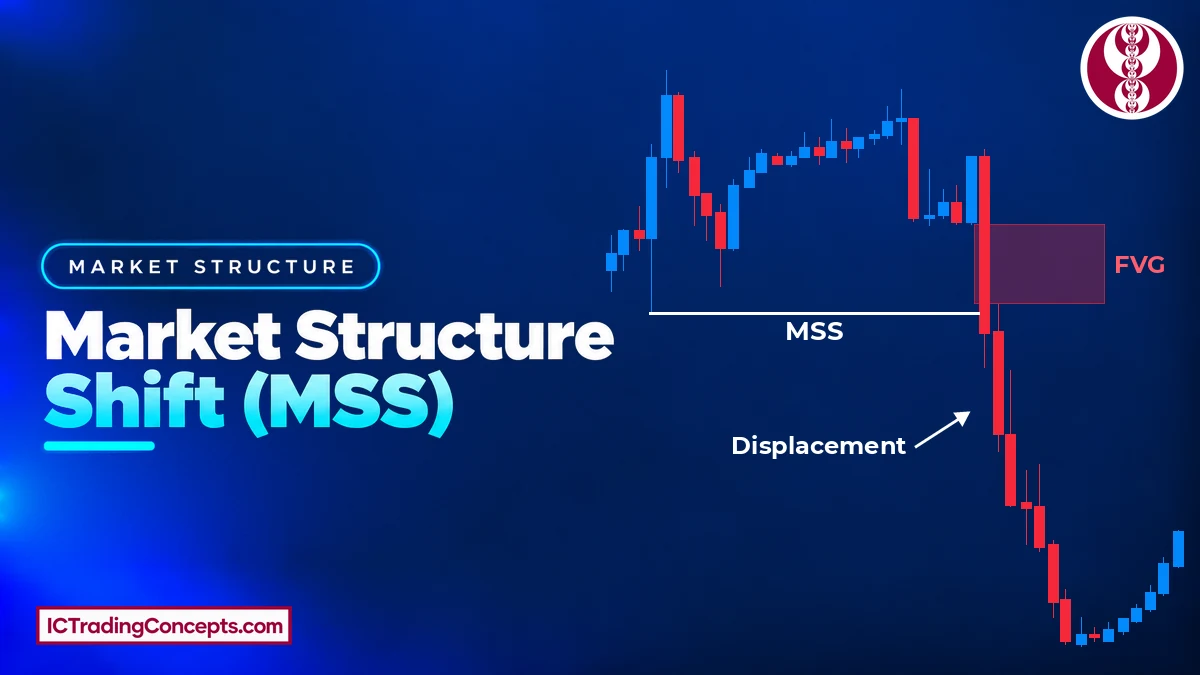
A market structure shift (MSS) is ICT's term for a break against the last price leg that is made with intent. A candle body closes beyond the short-term swing that launched that leg. The move that does it is a displacement: large, decisive candles with small wicks and little overlap. It usually leaves a fair value gap (FVG), the clearest sign of displacement. A bullish MSS closes above the last short-term swing high. A bearish MSS closes below the last short-term swing low.
A wick through the swing is not an MSS, and neither is a close made with small, overlapping candles. Once a real shift prints, traders wait for price to pull back into the FVG, order block or breaker block left by the displacement leg. The stop goes beyond the swing before the shift, and the target is the liquidity on the opposite side.
Key Takeaways
- An MSS is a candle body close beyond the short-term swing that launched the last leg, made with displacement: large, decisive candles that usually leave a fair value gap.
- A wick through the swing does not count, and a close without displacement does not count.
- A liquidity sweep before the shift, a higher-timeframe PD array and the daily bias make an MSS stronger. They are context, not part of the definition.
- The entry comes on the pullback into the FVG, order block or breaker block left by the displacement leg, not on the break candle itself.
- The stop sits beyond the swing before the shift (beyond the sweep's extreme in a sweep setup), and the target is the opposite liquidity.
What Is a Market Structure Shift (MSS) in ICT?
Market structure shift (MSS) is a term from the Inner Circle Trader (ICT) method of Michael J. Huddleston. It marks the point where price stops building the current leg and breaks the other way with force. The market structure shift definition has one level and two conditions.
- The level: the short-term swing that launched the last leg. After a falling leg, that is the last short-term swing high. After a rising leg, it is the last short-term swing low.
- Condition 1, body close: a candle body closes beyond that swing. A wick that pokes through and closes back inside does not count.
- Condition 2, displacement: the break comes from large, decisive candles with small wicks and little overlap. The leg usually leaves a fair value gap, the clearest sign of displacement, but the FVG is not a separate condition. An FVG is a three-candle imbalance where the wicks of candle 1 and candle 3 do not overlap.
When both conditions hold on the same break, the last leg, the one that started at that swing, has failed. Price has delivered in the new direction with force. The fair value gap it usually leaves is the footprint traders use later for the entry.
A liquidity sweep, a higher-timeframe PD array and the daily bias are context that can make an MSS stronger (see "What Makes an MSS Stronger?"), not part of the definition.
How Does a Market Structure Shift Form?
Every MSS follows the same order of events. The swing comes first, then the leg, then the displacement back through the swing.
- Price prints a short-term swing: a swing high during a falling move, a swing low during a rising move.
- The last leg moves away from that swing and runs to its own high or low.
- Price turns and delivers back toward the swing with large candles.
- A candle body closes beyond the swing, made with displacement. The leg usually leaves an FVG.
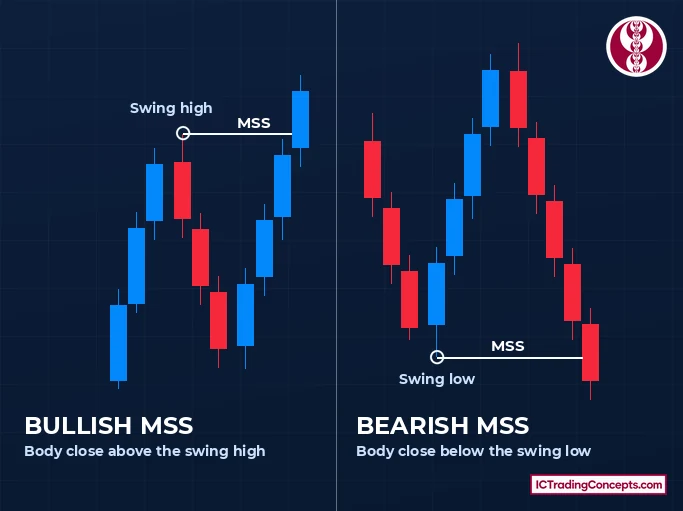
Bullish MSS: Close Above the Swing High
A bullish MSS forms after a falling leg. That leg starts from a short-term swing high. When a bullish displacement leg closes a candle body above that high, the shift is in place.
In the market structure shift example below, price makes a short-term high and drops to a short-term low. A run of large bullish candles then closes well above the high. Those candles barely overlap, so the leg leaves a fair value gap on its way up.
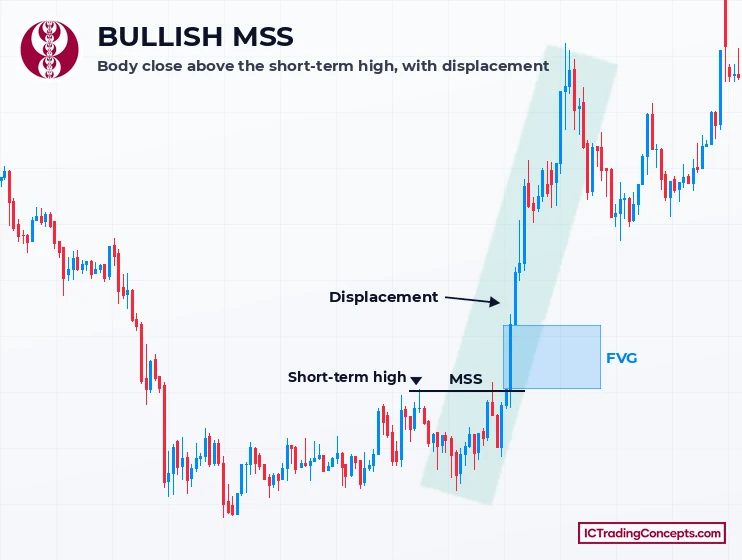
After the shift, the low of the last leg becomes the swing before the shift. That low matters later, because the stop goes beyond it.


Bearish MSS: Close Below the Swing Low
A bearish MSS is the mirror case. After a rising leg, the last leg up starts from a short-term swing low. A bearish displacement leg that closes a body below that low completes the shift.
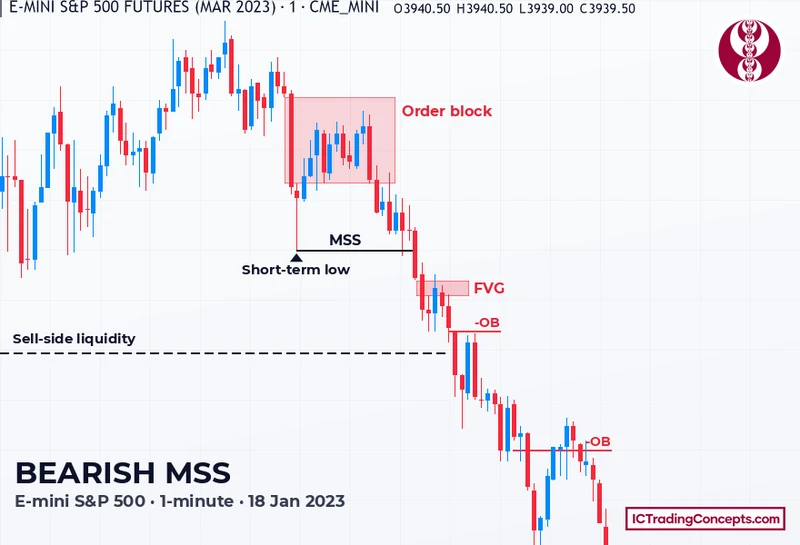
The chart below is the E-mini S&P 500 1-minute chart from 18 January 2023, the session ICT reviews in the video further down. Shortly after 10:15 New York time, price made a short-term low and rallied on a series of up-close candles, which ICT marks as a bearish order block. A large bearish candle then closed below that low, and the leg left a fair value gap. Price kept falling into the sell-side liquidity under the morning lows.
How to Identify an MSS on the Chart
Identifying an MSS means checking one level and two conditions, in this order.
- Find the last leg and mark the short-term swing where it started.
- Wait for the candle to close. Compare the body close with that swing, not the wick.
- Look at the candles that made the break. They should be large and decisive, with small wicks and little overlap. An FVG in the leg is the clearest sign of that displacement.
- If all three checks pass, mark the FVG, order block or breaker block in that leg for the pullback.
Which Swing Must Break?
The level is the short-term swing that launched the last leg. Follow the last leg back to its origin, and the swing at that origin is the level.
A short-term swing high is a three-candle pattern whose middle candle has a higher high than the candles on both sides. A short-term swing low is the mirror: a middle candle with a lower low than both neighbours.
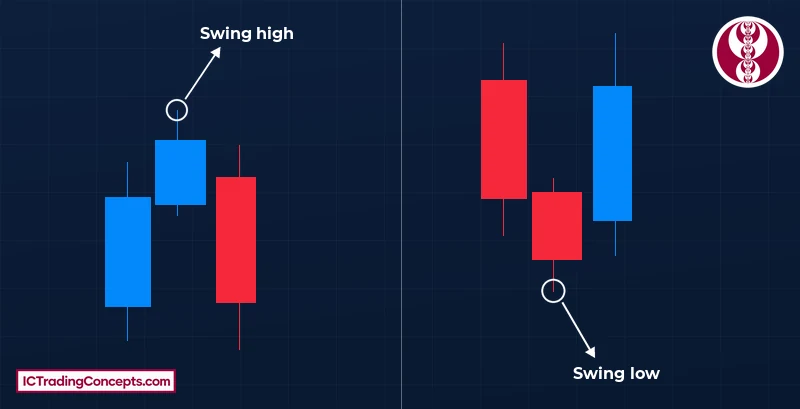
- Bullish MSS: the last leg is a fall, so the level is the short-term swing high where that fall began.
- Bearish MSS: the last leg is a rise, so the level is the short-term swing low where that rise began.
Body Close With Displacement, Not a Wick
Two kinds of break look like an MSS and are not.
- A wick through the swing: price trades beyond the level, but the candle closes back inside it.
- A close without displacement: the body closes beyond the swing, but the move is made of small, overlapping candles.
An MSS needs both conditions on the same break. The body closes beyond the swing, and the candles that do it are large and decisive. They usually leave a fair value gap, the clearest sign of displacement. If the close comes from small, overlapping candles, there is no shift yet. A later candle can still close beyond the swing with displacement and complete it.


Why a Market Structure Shift Matters
An MSS turns a vague idea ("the trend may be turning") into exact chart references.
- Timing: the close beyond the swing shows when the old leg has failed. A trader waiting at a higher-timeframe level knows when to act.
- Entry zone: the displacement leg leaves an FVG, an order block or a breaker block that price may revisit before it continues.
- Invalidation: the swing before the shift gives a fixed level for the stop.
- Direction: the shift points toward the opposite liquidity, the resting orders beyond old highs after a bullish shift or old lows after a bearish one.
Without the MSS, a trader at a higher-timeframe level has no sign yet that the old leg has failed. With it, the trade has a trigger, a zone and a level that proves it wrong. In MSS trading, the higher-timeframe level gives the location and the shift gives the trigger.
What Makes an MSS Stronger?
Three pieces of context raise the quality of an MSS. None of them is part of the definition.
- A liquidity sweep before the shift: price first runs beyond an old high or low and takes the stops resting there, then shifts the other way. A bearish setup sweeps buy-side liquidity above a swing high. A bullish setup sweeps sell-side liquidity below a swing low.
- A higher-timeframe PD array: the shift prints as price trades into an order block, a fair value gap or another PD array on the 4-hour or daily chart.
- The daily bias: the shift agrees with the direction the daily chart points to.
The common setup puts these in order: sweep, MSS with displacement, then a pullback to the array the displacement left behind.
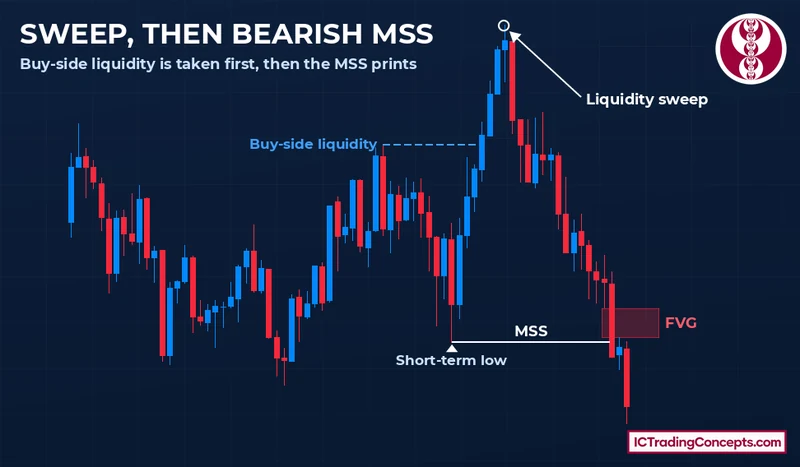
In the bearish example above, price runs above a short-term swing high and takes the buy-side liquidity there. It cannot hold, and the drop that follows closes below the swing low that launched the run. The sweep comes first, and the shift confirms it.
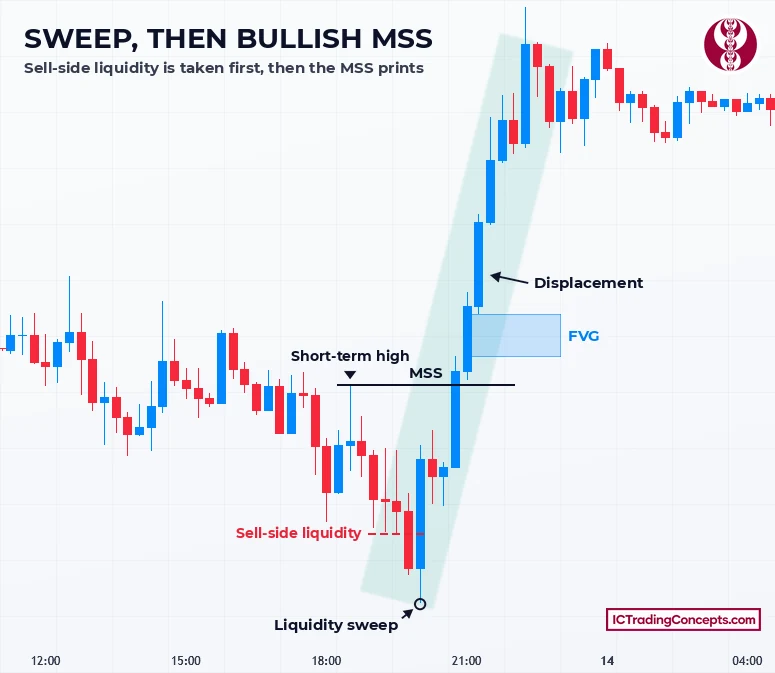
The bullish example below shows the same sequence from the other side. The final low trades under a row of earlier lows and takes the sell-side liquidity resting below them. The next leg up closes above the swing high that started the last leg down, and it leaves a fair value gap as it goes.
Where BOS and CHoCH Fit Next to an MSS
Two other structure terms sit close to the MSS, and each has its own page.
A break of structure (BOS) is a break in the trend's direction. It confirms continuation, not a turn.
SMC traders call a break against the trend a change of character (CHoCH). On this site an MSS needs displacement, so its closest SMC equivalent is a CHoCH made with clear displacement.
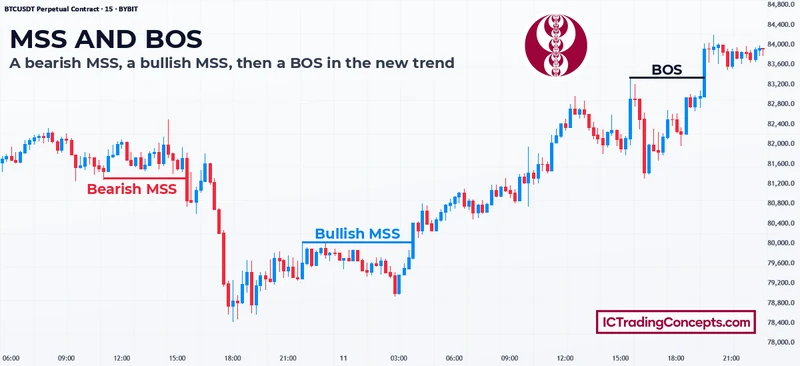
On this Bitcoin perpetual futures chart (15-minute), a bearish MSS starts the drop and a bullish MSS ends it. A later break of a high inside the new rise is a BOS.
How Traders Use an MSS in Practice
In practice, an MSS is a timing tool inside a larger plan. The higher timeframe shows where a reversal may start. The MSS on a lower timeframe shows when it has started, and the displacement leg gives the zone for the entry.
In the video below, ICT walks through the E-mini S&P 500 session of 18 January 2023 on the 5-minute and 1-minute charts. He explains which short-term low he waited for, and why he held back on an earlier break. He expected price to sweep the previous day's high first, and that sweep had not happened. That is the context described above at work, not an extra condition in the definition. He then shows the short entries from the fair value gap and the bearish order block left by the displacement leg.



Entry on the Pullback: FVG, Order Block or Breaker
The ICT MSS entry comes after the shift, on the pullback. The displacement leg can leave three kinds of zone, and any of them can serve as the entry:
- Fair value gap: the imbalance between candle 1 and candle 3 inside the leg.
- Order block: the last opposite candle, or run of opposite candles, before the displacement: down-close candles before a bullish leg, up-close candles before a bearish leg.
- Breaker block: a failed order block that the displacement leg broke through.
Entering on the break candle itself means buying or selling at the end of a fast move, with the stop far away. Waiting for the pullback puts the entry inside the zone the leg left, closer to the swing that defines the stop.
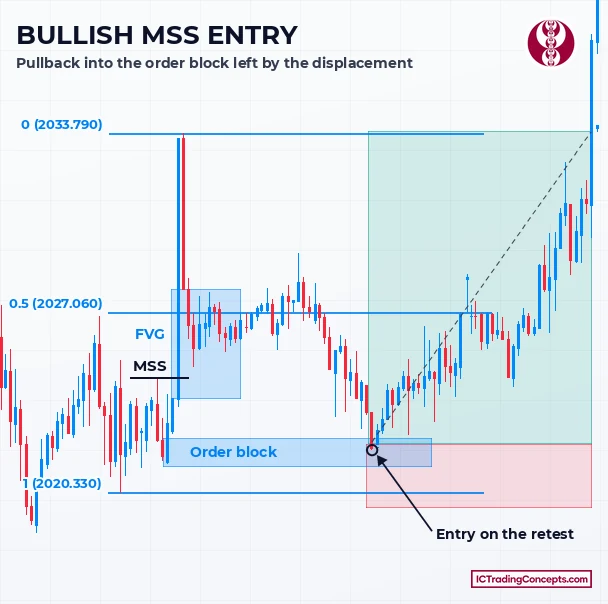
In the bullish example, the order block is the last down-close candle before one very large bullish candle. That candle closes far above the swing high and leaves a fair value gap. Price then drifts back into that order block before the next leg up.
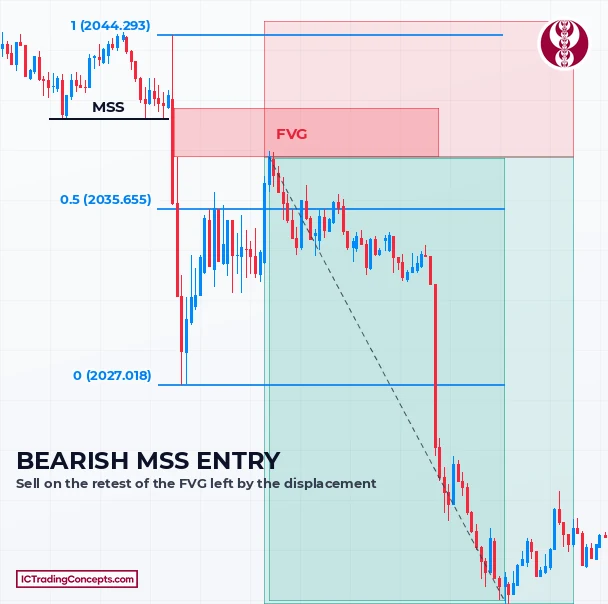
The bearish example shows the same entry on the other side. A large bearish candle closes below the short-term swing low that launched the last leg up, and the displacement leaves a fair value gap. Price climbs back into that FVG, and the sell comes on the retest. The stop sits above the high of the move, and the target is the sell-side liquidity below.
Stop Beyond the Swing, Target at Opposite Liquidity
The stop goes beyond the swing before the shift. In a bullish MSS, that is the low of the last leg down. In a bearish MSS, it is the high of the last leg up. When a sweep came first, the stop goes beyond the sweep's extreme, because a move back through it cancels the setup.


The target is the opposite liquidity. After a bullish shift, it is the buy-side liquidity above old highs. After a bearish shift, it is the sell-side liquidity below old lows. In the E-mini example, the sell-side liquidity under the morning lows was the first target.
No fixed reward-to-risk multiple is part of the model. The chart sets both distances: the swing before the shift sets the stop, and the opposite liquidity sets the target.
Using an MSS Across Timeframes and Markets
The rule is the same on every timeframe: a body close beyond the short-term swing that launched the last leg, made with displacement. A 1-minute MSS and a daily MSS differ only in the size of the leg and the swing.
The usual way to combine timeframes is a higher-timeframe PD array with the MSS on a lower timeframe for timing. A trader marks an order block, a fair value gap or a rejection block on the daily or 4-hour chart. When price reaches it, the trader drops to the 5-minute or 1-minute chart and waits for the MSS.


The rule does not change from market to market either. The examples on this page come from the E-mini S&P 500, GBP/USD and a Bitcoin perpetual. A market structure shift in forex pairs such as EUR/USD is read the same way.
Common Mistakes
Each of these errors breaks a part of the definition or swaps context for it.
- Counting a wick. A wick through the swing that closes back inside is not a shift. Wait for the body close.
- Accepting a close without displacement. Small, overlapping candles that drift beyond the swing are not displacement. That close is not an MSS.
- Using the wrong swing. The level is the short-term swing that launched the last leg, not an older swing further back or a small wiggle inside the leg.
- Calling a sweep a shift. A run beyond an old high or low is context. Until a body closes beyond the swing with displacement, there is no MSS.
- Entering on the break candle. The entry belongs on the pullback into the FVG, order block or breaker block.
- Placing the stop at the broken level. The stop goes beyond the swing before the shift, or beyond the sweep's extreme, not just past the level that broke.
MSS Indicators on TradingView
A market structure shift indicator can mark swings and breaks for you. These tools do not check every part of the definition the same way. Confirm the body close and the displacement on the chart before you treat a marked break as an MSS.
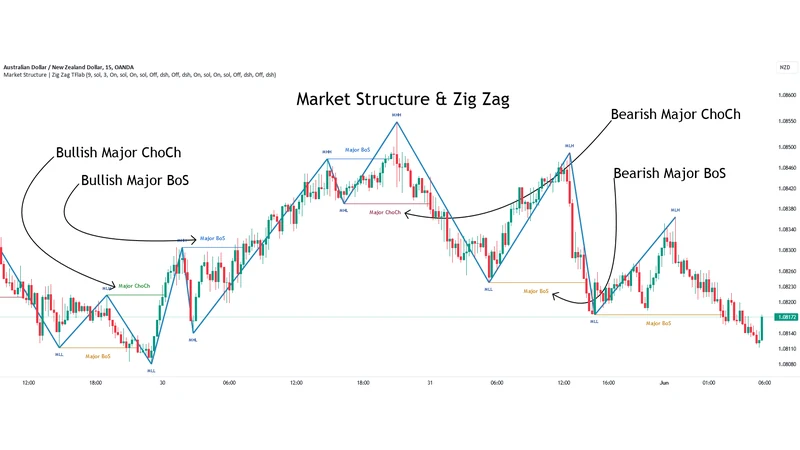
Market Structures + ZigZag [TradingFinder] CHoCH/BOS - MSS/MSB
Connects swing highs and lows with a zigzag and labels the breaks between them, so the swing that launched the last leg is easy to find. It labels the shift CHoCH, its name for an MSS, and that label can fire on a wick, so check the body close and the displacement yourself.
View on TradingView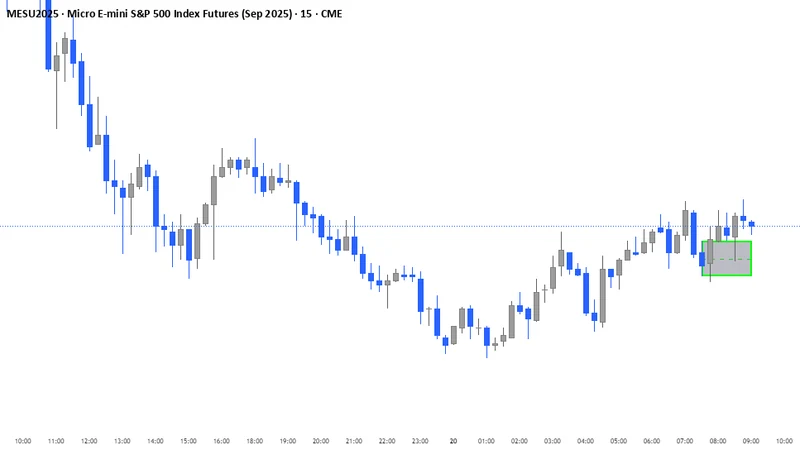
MSS Boxes
Marks structure shifts made with displacement and draws a zone from the candle that caused the shift, a quick way to see where a pullback could return. Check the body close and the displacement yourself.
View on TradingView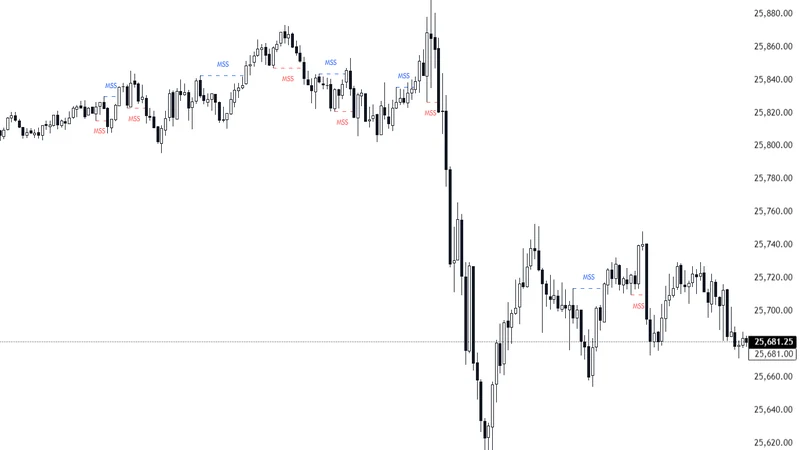
Market Structure Shift (MSS) [Sword & Shield]
Draws a line at each swing high or low that price breaks. An option counts a break only on a candle close, which matches the body-close rule. It does not check displacement, so check the body close and the displacement yourself.
View on TradingViewTest Your Market Structure Shift (MSS) Knowledge
Eight quick questions on the swing that must break, the body close with displacement, the role of the FVG, context versus definition, the pullback entry, the stop and the BOS. Each answer links back to the section that explains it.
ABCD Answer with your keyboard
-
01Which level has to break for a market structure shift?
The level is the short-term swing that launched the last leg. After a falling leg it is the last short-term swing high; after a rising leg, the last short-term swing low. Review: this section
-
02A wick trades above the swing high, but the candle closes back below it. What is it?
A wick that pokes through the swing and closes back inside does not count. Wait for the body close. Review: this section
-
03A candle body closes beyond the swing, but the move is made of small, overlapping candles. What is it?
An MSS needs the body close and displacement on the same break. A later candle can still close beyond the swing with displacement and complete it. Review: this section
-
04What role does the fair value gap play in an MSS?
The displacement leg usually leaves an FVG, the clearest sign of displacement, but the FVG is not a separate condition. Traders use it later for the entry. Review: What Is a Market Structure Shift (MSS) in ICT?
-
05Which of these is context that makes an MSS stronger, not part of its definition?
A liquidity sweep, a higher-timeframe PD array and the daily bias raise the quality of an MSS. None of them is part of the definition. Review: What Makes an MSS Stronger?
-
06Where does the entry come after a market structure shift?
The entry comes after the shift, on the pullback. Entering on the break candle means trading at the end of a fast move, with the stop far away. Review: this section
-
07In a bullish MSS trade with no sweep before it, where does the stop go?
The stop goes beyond the swing before the shift: in a bullish MSS, the low of the last leg down. When a sweep came first, it goes beyond the sweep's extreme. Review: this section
-
08How does a break of structure (BOS) differ from an MSS?
A BOS is a break in the trend's direction. It confirms continuation, not a turn. SMC's name for a break against the trend is a CHoCH. Review: Where BOS and CHoCH Fit Next to an MSS
Review your answers
Conclusion
A market structure shift comes down to one level and two conditions. The level is the short-term swing that launched the last leg. The conditions are a body close beyond it and displacement: large, decisive candles, which usually leave a fair value gap. A sweep, a higher-timeframe PD array and the daily bias make it stronger without changing what it is.
Once it prints, the chart sets the plan. Enter on the pullback into the FVG, order block or breaker block. Place the stop beyond the swing before the shift. Target the opposite liquidity.
Sources
- Perpetual futures: Wikipedia
- ICT's review of the E-mini S&P 500 session of 18 January 2023, 5-minute and 1-minute charts: ICT Gems, YouTube
Be the first to share your thoughts on this article.