

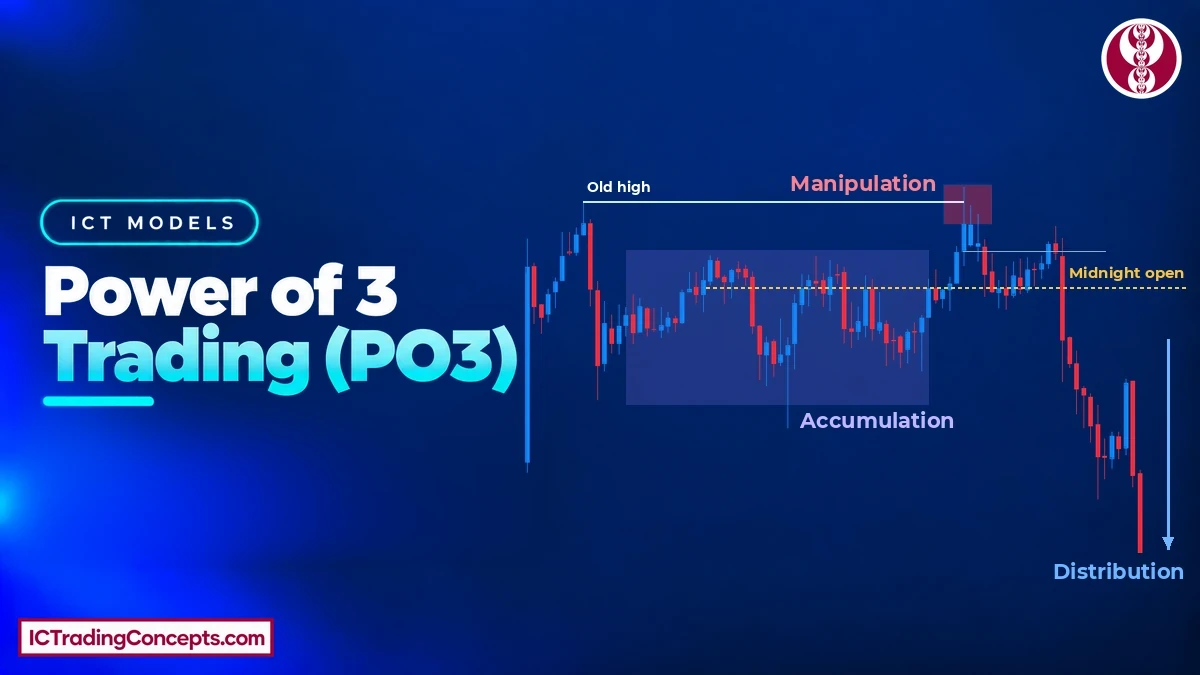
Power of 3 trading is an ICT model that reads one trading day as three phases around the opening price at midnight New York time: accumulation, manipulation and distribution (AMD). Price first builds a tight range near the daily open. It then makes a false move against the day's bias to sweep the stops beyond that range. Only after that false move fails to hold beyond the level does price deliver the real move toward the day's high or low.
Key Takeaways
- Three AMD phases: accumulation near the daily open, manipulation against the bias, distribution in the bias direction.
- One reference level: the opening price at midnight New York time. A bullish day runs below it first; a bearish day runs above it first.
- Manipulation is a liquidity sweep: it takes the stops beyond the range, fails to hold beyond the swept level and turns back.
- Only distribution is traded: the entry comes after a lower-timeframe MSS in the bias direction, from a PD array left in the displacement leg.
- Risk is defined by the sweep: the stop sits beyond the sweep candle's wick; the target is the opposite end of the daily range or the next liquidity pool.
What Is Power of 3 Trading in ICT?
The ICT Power of 3 concept is a daily price-delivery model taught by Michael J. Huddleston, the Inner Circle Trader (ICT). Traders also call it PO3, or accumulation, manipulation, distribution (AMD), after its three phases. The model describes how a single trading day builds its range: a quiet build-up near the open, a false move to one side, and then the move that sets the day's high or low. "Smart money" here means institutional investors whose size cannot be filled at one price.
The Power of 3 does not set the bias. It does not tell you whether the day will rise or fall. It describes how a day that is expected to rise, or fall, usually gets there. The bias always comes first, from the daily and 4-hour charts.
How the AMD Phases Form Around the Daily Open
Every Power of 3 day is read from one level: the opening price at midnight New York time. ICT treats midnight as the start of the trading day for this model. The three phases then form in a fixed order around that price, and each one has its own job.
Accumulation: A Tight Range Near the Open
Accumulation, the first phase of AMD, begins at the daily open. Price moves sideways in a narrow horizontal range close to the opening price, with little net progress. In ICT's terms, this is where large players build their positions without moving price far.
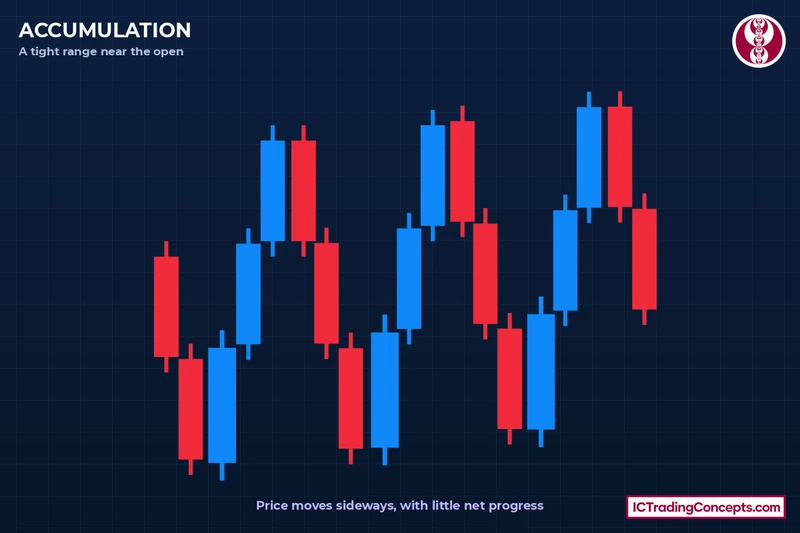
The range has a clear high and a clear low. Retail traders tend to buy near its low and sell near its high, and they place their stops just beyond those edges. Those stops are the liquidity the next phase targets. ICT's own lesson describes the same accumulation around the daily opening price.


Manipulation: The False Move Against the Bias
Manipulation is a sharp move out of the range in the direction opposite to the day's bias. On a bullish day it drops below the open and the accumulation low. On a bearish day it rises above the open and the accumulation high.
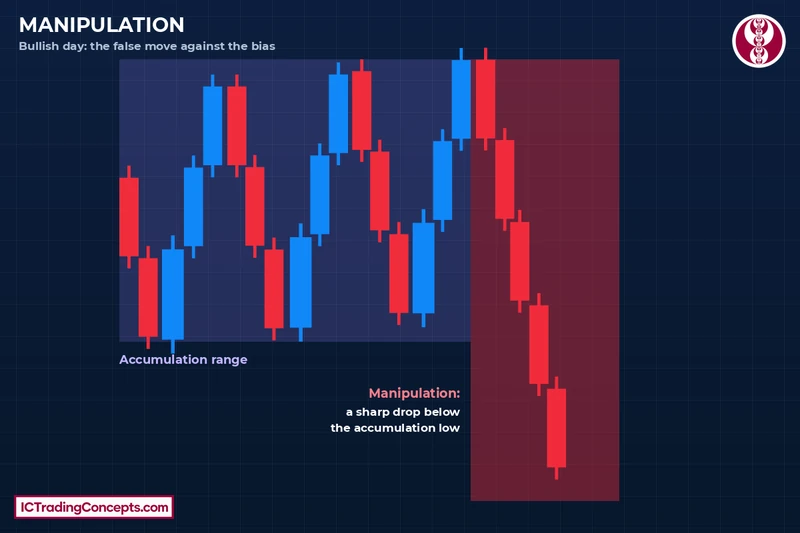
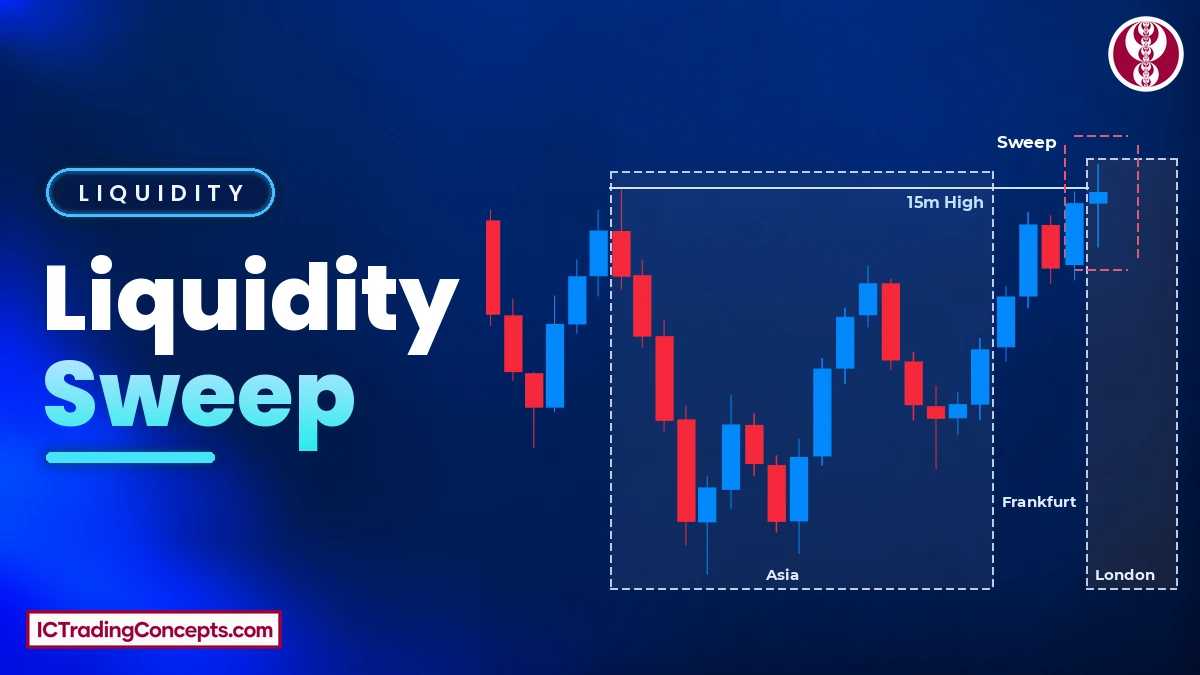
The move is a liquidity sweep. It triggers the stops resting beyond the range and pulls breakout traders in on the wrong side. Then it fails to hold: price stops making progress beyond the swept level and turns back toward the open. ICT also calls an early false move of this kind a Judas swing.
A manipulation looks exactly like a breakout. A break that runs against the bias is only a candidate. It becomes the manipulation once it fails at the swept extreme, turns back and a lower-timeframe MSS confirms the turn. If it holds beyond the level instead, it is a failure to manipulate, and there is no trade.
Distribution: The Real Move of the Day
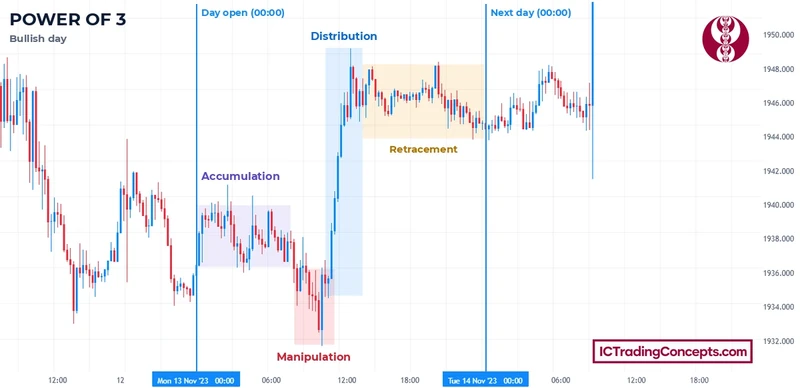
Distribution is the move in the direction of the bias. After the sweep, price reverses back through the open with displacement and travels toward the day's high on a bullish day, or its low on a bearish day. Old highs (bullish) or old lows (bearish) are its targets, because they hold the next pool of resting orders.
In this model the day then tends to close near the extreme it was heading for. On the charts in this guide, the box labelled Retracement marks the pullback after distribution; it is not a fourth AMD phase. Distribution is the only phase that is traded. Accumulation is still building, and manipulation is the trap.

Bullish vs Bearish Power of 3
The two versions follow the same three AMD phases in opposite directions. What changes is the side of the open where the false move happens, and which pool of stops it takes.
| Bullish Power of 3 | Bearish Power of 3 | |
|---|---|---|
| Bias (daily, 4-hour) | Up | Down |
| Manipulation | Runs below the open and the range low | Runs above the open and the range high |
| Liquidity taken | Sell stops under old lows | Buy stops above old highs |
| Distribution | Rally toward old highs | Decline toward old lows |
| Daily candle | Wick below the open, close near the high | Wick above the open, close near the low |
Bullish Power of 3: The Run Below the Open
On a bullish day, price accumulates near the opening price. The manipulation then sells off below the open and runs under a nearby old low. Sellers enter on what looks like a breakdown, and early buyers are stopped out under the low.
That is where the reversal starts. Price fails below the swept low and turns up through the open. The distribution leg targets old highs, and the daily candle prints a wick below the open with a close near the high.
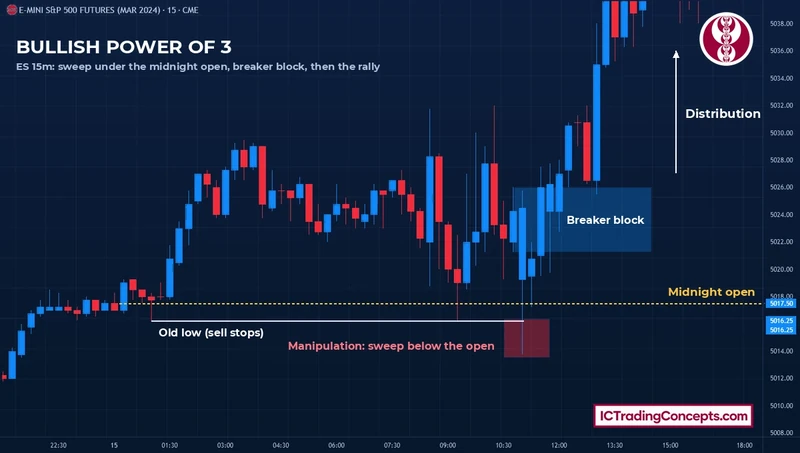
The chart below shows a bullish day on E-mini S&P 500 futures (ES), 15-minute chart. Price trades under the midnight open, sweeps an old low, then reverses through a breaker block and rallies away from the open.
Bearish Power of 3: The Run Above the Open
On a bearish day, the order flips. Price accumulates near the open, then rallies above it and runs over a nearby old high. Buyers chase what looks like a breakout, and early sellers are stopped out above the high.
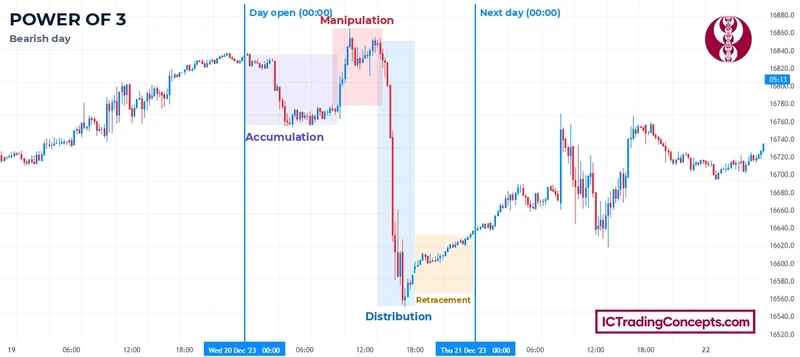
Price then fails above the swept high and turns down through the open. The distribution leg targets old lows, and the daily candle prints a wick above the open with a close near the low. In the example below, the drop that follows the failed rally runs far below the accumulation low within a few hours.
How to Mark Power of 3 on a Chart
Marking a Power of 3 day takes five reference points. The first two are drawn before the session; the rest are added as the day unfolds.
- Bias: decide the day's direction on the daily and 4-hour charts.
- Daily open: draw a horizontal line at the daily opening price.
- Accumulation range: once price has ranged near the open, mark the range high and low.
- Manipulation extreme: after the false move, mark the wick of the sweep candle. This is the reference for the stop, which goes beyond the wick with a small buffer.
- Liquidity target: mark the old high (bullish) or old low (bearish) that distribution is expected to reach.
The same marks also explain the shape of the daily candle. The false move sets the wick on the far side of the open, and distribution sets the body.
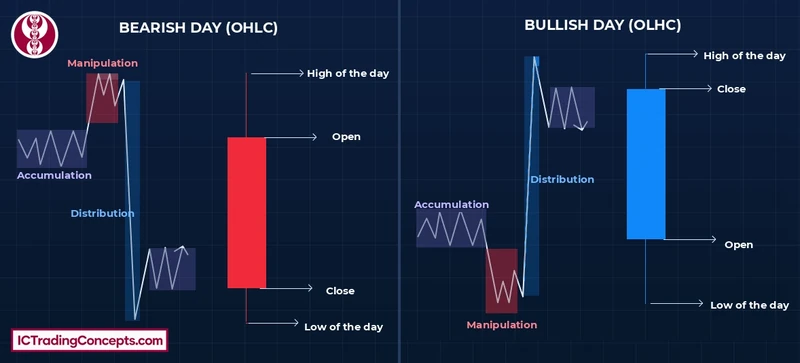
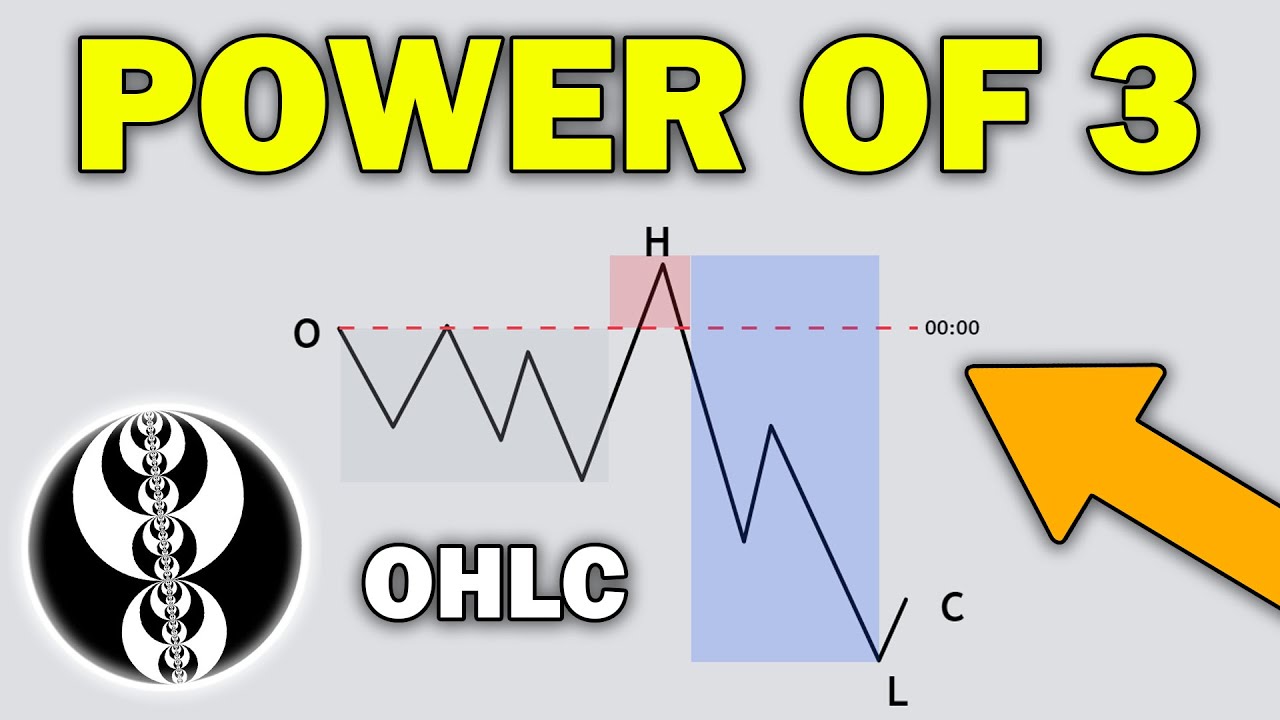
In the model's typical scenario, a bullish day prints open, low, high, close (OLHC) and a bearish day prints open, high, low, close (OHLC), though not every day follows it.


Which Timeframes Does PO3 Use?
The model uses three groups of timeframes, and each group has its own job.
- Daily and 4-hour: set the bias and locate the liquidity targets.
- 15-minute (or 5-minute): read accumulation, manipulation and distribution around the open.
- 5-minute and 3-minute: confirm the reversal and refine the entry inside the distribution leg.
The same AMD sequence can also appear on other timeframes. This guide reads it on the daily range, with the daily open as its reference.
Why Does Price Run Against the Bias First?
The false move is about liquidity. A large buy order needs sellers on the other side, and a large sell order needs buyers. Sell stops below a range low become market sell orders when they trigger, so a run below the low supplies sellers to a large buyer. A run above a range high does the same for a large seller.
That is why ICT describes manipulation as engineered rather than random. The sweep fills the larger orders at a better price, and the market is then free to move toward its real target. It also explains where the reversal happens: on a bullish day, buying below the open means buying at a discount to the day's opening price.
This is ICT's explanation of the pattern, not a measured fact about order flow. Treat it as the reason the model waits for the sweep, not as proof that every sweep reverses.
PO3 vs Commonly Confused Concepts
Five related terms are easy to mix up with the Power of 3 because they share its sweep, its opening price or its daily candle.
| Concept | What it is | How it differs from Power of 3 |
|---|---|---|
| Liquidity sweep | A run beyond an old high or low that takes the stops and fails to hold. | One event; in the Power of 3 it is the manipulation phase, read from the daily open. |
| Failure to manipulate | A high or low is taken, but the expected reversal never forms. | A breakout continuation setup; for the Power of 3 it means no trade. |
| New day opening gap | The gap between the 5:00 PM New York close and the 6:00 PM reopen in index futures. | A two-price reference area; the Power of 3 reads the day from one price, the midnight open. |
| Judas swing | ICT's name for the early false move against the day's direction. | It names only the false move; the Power of 3 covers the whole day. |
| OHLC / OLHC | The order of a day's prices: open, high, low, close, or open, low, high, close. | It describes the finished daily candle; the Power of 3 explains how the day builds it. |
How Traders Use PO3 in Practice
Used as a power of 3 trading strategy, the model is a way to time an entry in the direction of a bias you already hold. The video below walks through the model on NQ and ES futures, with the midnight opening price marked on each chart.
Trade Flow, Step by Step
The ICT Power of 3 strategy below follows one trade from bias to target. Each step depends on the one before it, so a missing step means no trade.


- Set the bias: read the daily and 4-hour charts before the session opens.
- Mark the daily open: draw the opening price at midnight New York time.
- Wait for accumulation: let a tight range form near the open, then mark its high and low. Do not pre-position.
- Wait for the manipulation: price runs against the bias and sweeps the stops beyond one side of the range.
- Confirm the sweep: price must fail at the swept extreme and reverse. If it holds beyond the level and keeps going, the move is a failure to manipulate, not a sweep, and there is no trade.
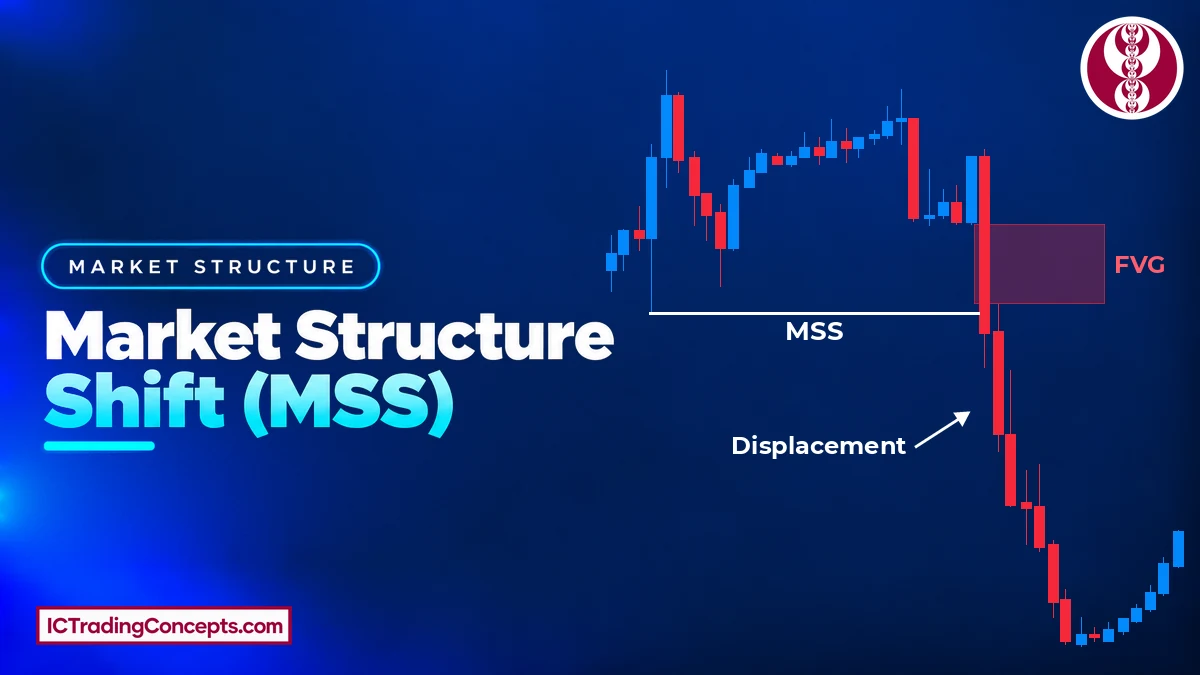
- Drop to the lower timeframe: on the 5-minute or 3-minute chart, wait for a market structure shift (MSS) in the bias direction, made with displacement.
- Mark the PD array: find the fair value gap, order block or breaker block (a failed order block) left in the displacement leg.
- Enter on the retrace: take the entry when price returns to that PD array.
- Place the stop: beyond the wick of the sweep candle, with a small buffer.
- Set the target: the opposite end of the daily range, or the next significant liquidity pool: old highs for longs, old lows for shorts.
The ES chart in the bullish example shows steps 4, 5 and 7 on a real day: the sweep of the old low, the failure below it and the breaker block left in the displacement leg.
Timing matters as much as the pattern. The model tends to work best around the London open and the New York AM session, and it is weaker during the Asia lunch and New York lunch windows.
Common Mistakes
Most errors with this model come from acting one phase too early. Four of them come up again and again.
- Trading the manipulation as a breakout, or entering on the sweep alone: the false move looks like a classic breakout, and a sweep on its own is not a signal. A break against the bias is only a candidate: it becomes the manipulation once price fails to hold beyond the swept level and a lower-timeframe MSS confirms the turn in the bias direction.
- Trading without a bias: the Power of 3 is a directional model. Without the daily and 4-hour bias, manipulation and distribution cannot be told apart.
- Placing the stop inside the manipulation range: the sweep candle often runs a little beyond the prior extreme before it turns. Put the stop beyond its wick, with a small buffer.
- Forcing the model in quiet hours: setups during the Asia lunch and New York lunch windows are weaker. If no clean AMD setup forms, there is no Power of 3 trade that day.
Power of 3 (AMD) Indicators on TradingView
An ICT Power of 3 indicator can mark the AMD phase windows and the daily open automatically. These tools mark time and levels only; the bias and the confirmation are still the trader's call.
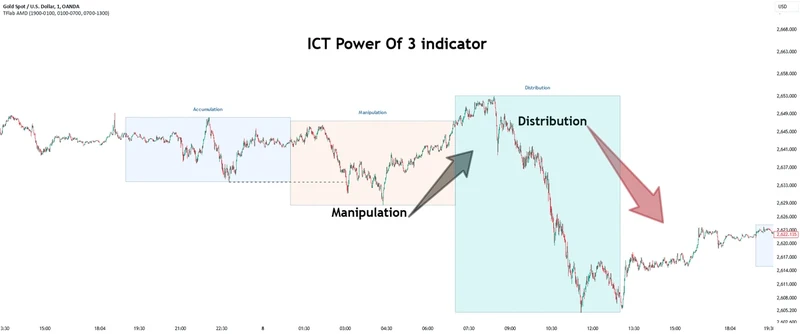
Power Of 3 ICT 01 [TradingFinder] AMD ICT & SMC Accumulations
Shades fixed time windows for accumulation, manipulation and distribution, by default starting at 19:00 New York time. It marks time blocks, not the range around the midnight open.
View on TradingView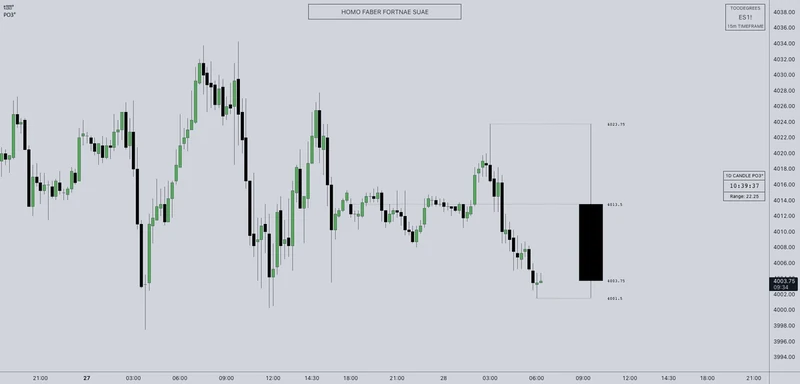
HTF Power of Three°
Draws the current higher-timeframe candle next to price on a lower-timeframe chart, so its open, wick and body can be watched while the day's phases form.
View on TradingView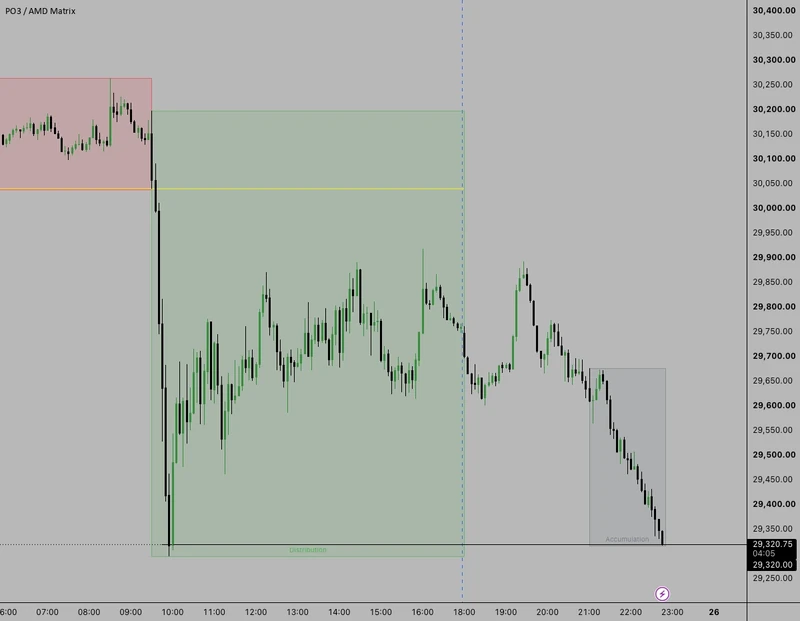
PO3 / AMD Matrix
Splits the day into three time windows, boxes the accumulation range and draws the midnight opening price across the session.
View on TradingViewTest Your Power of 3 Trading (ICT PO3) Knowledge
Eight questions on the midnight open, where the manipulation runs and when it counts, which phase is traded, the OLHC and OHLC days, the timeframes, the entry and the stop. Each answer links back to the section that explains it.
ABCD Answer with your keyboard
-
01What is the reference level of a Power of 3 day in this guide?
Every Power of 3 day is read from one level: the opening price at midnight New York time. The three phases form around that price. Review: How the AMD Phases Form Around the Daily Open
-
02On a bullish Power of 3 day, where does the manipulation run?
On a bullish day the false move drops below the open and the accumulation low, then fails to hold and turns up. Review: Manipulation: The False Move Against the Bias
-
03A break runs against the bias. When does it count as the manipulation?
A break against the bias is only a candidate. If it holds beyond the level instead, it is a failure to manipulate and there is no trade. Review: Manipulation: The False Move Against the Bias
-
04Which phase of the Power of 3 is traded?
Distribution is the only phase that is traded. Accumulation is still building, and manipulation is the trap. Review: Distribution: The Real Move of the Day
-
05In the model's typical scenario, which order does a bullish day print?
A bullish day prints OLHC: the false move sets the low below the open, and distribution sets the high and the close near it. Not every day follows it. Review: How to Mark Power of 3 on a Chart
-
06Which timeframes set the bias for the Power of 3?
The daily and 4-hour charts set the bias and locate the liquidity targets. The 15-minute reads the phases, and the 5- and 3-minute confirm and refine the entry. Review: Which Timeframes Does PO3 Use?
-
07Where is the entry taken in the Power of 3 trade flow?
After the lower-timeframe MSS, mark the FVG, order block or breaker block from the displacement leg and enter when price returns to it. Review: Trade Flow, Step by Step
-
08Where does the stop go in a Power of 3 trade?
The sweep candle often runs a little beyond the prior extreme before it turns, so the stop goes beyond its wick with a small buffer. The opposite end of the range is the target. Review: Common Mistakes
Review your answers
Conclusion
Power of 3 trading, or AMD, reads one day as three phases around the daily open: a quiet range, a false move against the bias, and the real move toward the day's high or low. The model works only with a bias set on the daily and 4-hour charts. The trade is taken in distribution, after the false move has failed to hold beyond the swept level and a lower-timeframe MSS has confirmed the turn. The stop goes beyond the sweep wick, and the target is the opposite end of the daily range or the next liquidity pool.
Sources
- Accumulation around the daily opening price: ICT, YouTube
- Power of 3 on NQ and ES futures with the midnight open marked (video and chart frames): DanDowdTrading, YouTube
- Classic breakout trading: Wikipedia
Be the first to share your thoughts on this article.