

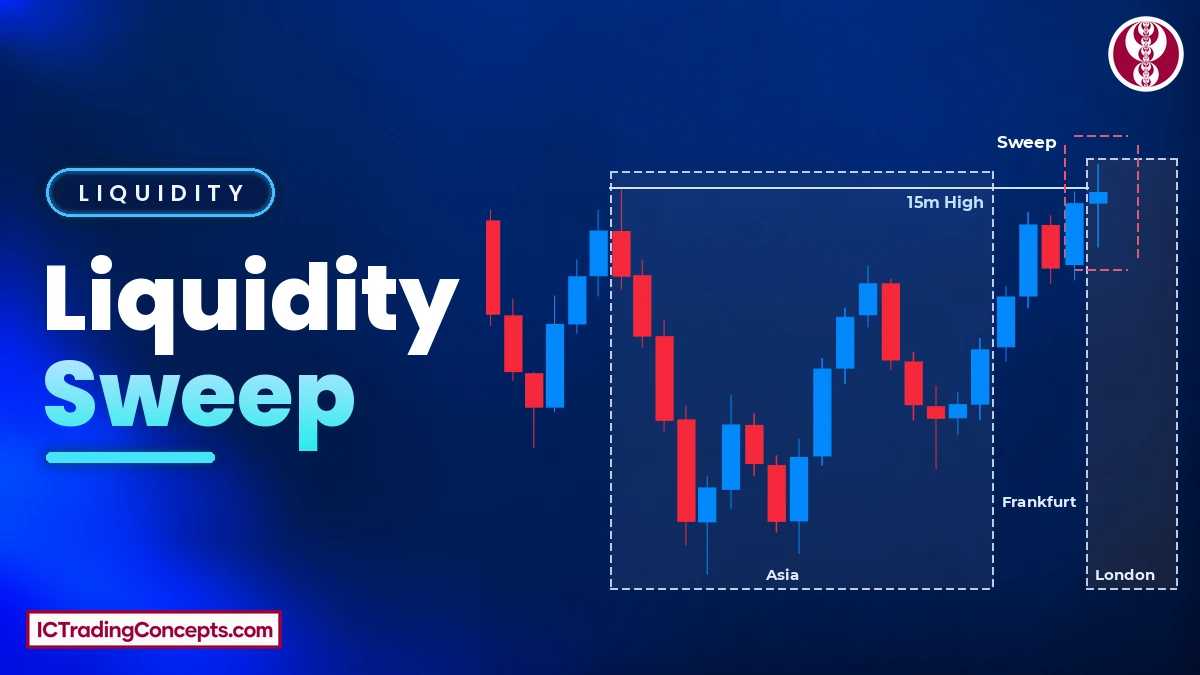
A liquidity sweep is a quick move beyond an obvious high or low where stop orders rest. Price takes those stops, fails to stay beyond the level and comes straight back inside, usually on the same candle or within the next few. ICT also calls this move a raid. The sweep shows where liquidity was taken; displacement and a market structure shift (MSS) show whether a reversal is really starting.
Key Takeaways
Five rules cover what a liquidity sweep is and how it becomes an ICT trade setup.
- A liquidity sweep takes the stops beyond an old high or low and fails to hold there. A wick through the level is enough, and a close beyond still counts if price comes straight back.
- Buy stops rest above old highs and equal highs (buy-side liquidity). Sell stops rest below old lows and equal lows (sell-side liquidity).
- If a candle closes beyond the level and price holds there with follow-through, it is a run or a breakout, not a sweep.
- The sweep is context, not an entry. Confirmation is displacement away from the level plus a market structure shift (MSS).
- The entry comes on the pullback into the FVG, order block or breaker block left by the displacement. The stop goes beyond the sweep's extreme, and the target is the opposite liquidity.
What Is a Liquidity Sweep in Trading?
In trading, the liquidity behind a sweep is a cluster of resting stop orders just beyond obvious highs and lows. A liquidity sweep is the move that reaches those orders, fills them and then fails to continue. In ICT terms, price raids the liquidity beyond the high or low.
So the liquidity sweep meaning comes down to two parts: the stops beyond an obvious level are filled, and price comes straight back inside, usually on the same candle or within the next few. A move that does only the first part is not a sweep.
Classic technical analysis describes the same idea as a Wyckoff spring (at a low) or an upthrust (at a high), or simply as a false breakout.
How Does a Liquidity Sweep Form?
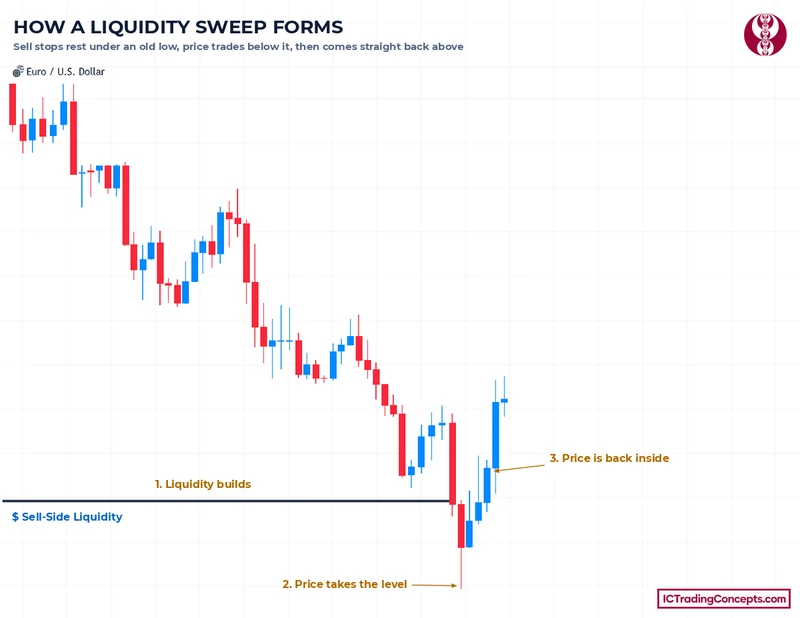
Every liquidity sweep forms in the same three steps, whatever the market or timeframe:
- Liquidity builds. Traders place stops beyond an old high or low, and the level becomes obvious on the chart.
- Price takes the level. A quick push trades through it and fills the stops resting there.
- Price fails beyond it. The candle wicks back, or closes beyond and returns straight away, and price is back inside the old high or low.
The side of the level gives the sweep its name. A sweep above a high takes buy-side liquidity. A sweep below a low takes sell-side liquidity.
The EUR/USD chart below shows the three steps on a real chart. Sell stops rest under an old low, two bearish candles trade below it, and within a few candles price is back above the level.
Where the Stops Rest Before a Sweep
A sweep needs a level that many traders can see, because only an obvious level gathers enough stops. These are the places where stop orders cluster:
- Above old highs and equal highs: buy stops. Short sellers protect their trades there, and breakout buyers enter there. This is buy-side liquidity.
- Below old lows and equal lows: sell stops. Long traders protect their trades there, and breakout sellers enter there. This is sell-side liquidity.
- The previous day's high and low.
- A session's high and low, such as the Asian session range before the London open.
- A range high or low, where price has turned several times.
Trendlines, Fibonacci levels and round numbers do not count as the reference for a liquidity sweep. The level is always a high or a low that price has already printed.


Sell-Side Liquidity Sweep (Bullish)
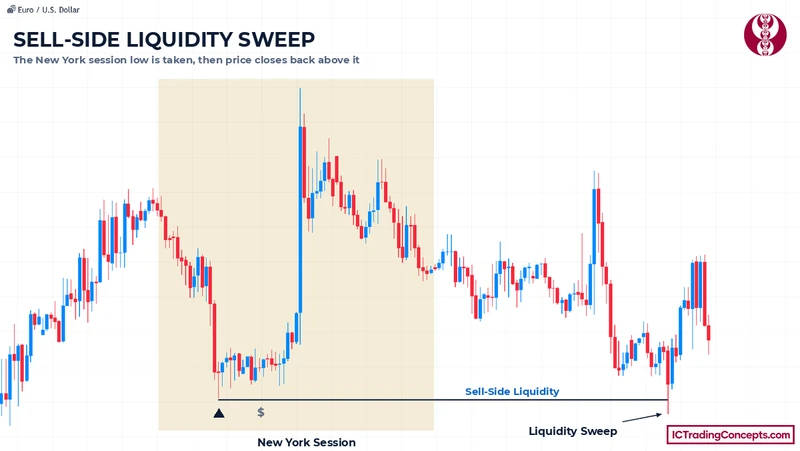
A sell-side liquidity sweep forms at a low. Price trades below an old low or equal lows, fills the sell stops of traders who were long and comes straight back above the level.
After the sweep, the bullish idea points up, toward the buy-side liquidity above the nearest old highs. In the example below, price takes the New York session low with a quick drop, returns above it and rallies.
Buy-Side Liquidity Sweep (Bearish)
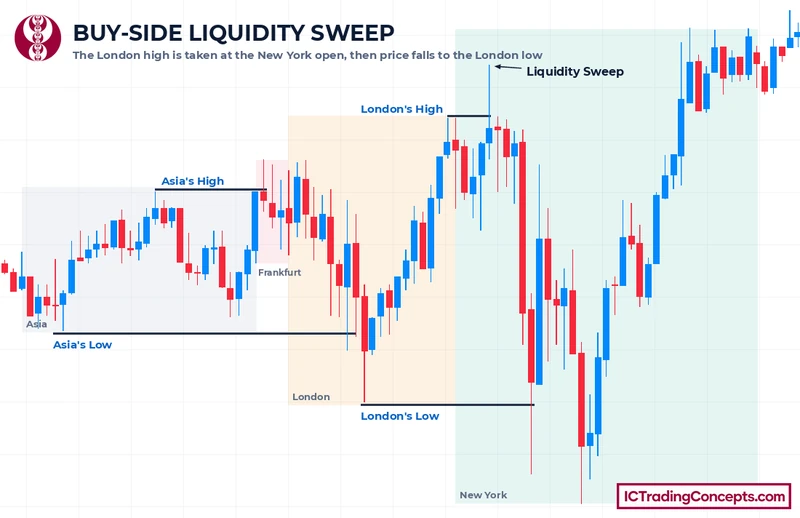
A buy-side liquidity sweep is the mirror at a high. Price trades above an old high or equal highs, fills the buy stops of short sellers and falls straight back below the level.
The bearish idea then points down, toward the sell-side liquidity below the nearest old lows. On the EUR/USD session chart below, a wick takes the London session high at the New York open. The candle closes back below it, and price falls to the London low.
How to Identify a Liquidity Sweep Correctly
Identifying a liquidity sweep comes down to two checks: was an obvious level taken, and did price stay beyond it? Work through them in this order:
- Mark the level before price reaches it: one of the obvious highs or lows listed above.
- Watch the candle that trades through it. It must actually trade beyond the level; stopping just short takes no stops.
- Judge the next few candles. Straight back inside means a sweep. A hold beyond the level with follow-through means it is not one.
A liquidity sweep candle can look different from chart to chart, but the test stays the same. The level decides where to look; the failure to hold decides what it is.
Wick or Close: Does a Liquidity Sweep Need a Close Back Inside?
A sweep needs price back inside; the candle does not have to close back inside. A wick beyond the level is enough: the candle trades through the old high or low, takes the stops and closes back inside. That wick leaves the zone ICT traders mark as a rejection block, from the candle body to the wick extreme.


A close beyond the level does not cancel the sweep either. If one candle closes above an old high and the next candles drive straight back below it, the stops were still taken and price still failed to hold. On a structure chart that close first reads as a break; when price comes straight back, it is a sweep, a false break. What matters is that price does not stay beyond the level.
If price settles beyond the level instead, the next section applies.
When Price Holds Beyond the Level, It Is Not a Sweep
If a candle closes beyond the level and price holds there with follow-through, the stops were taken but the move did not fail. That is a run or a classic breakout, not a liquidity sweep, and ICT traders read the missing reversal as a failure to manipulate.
Why a Liquidity Sweep Matters
A liquidity sweep shows where the market found the orders it needed. Every stop above a high is a buy order waiting to be triggered. When price trades through the high, those stops fill as market buy orders. That burst of buying gives a large seller the opposing orders to fill size. This is why a buy-side sweep can mark an area where institutional investors sold, and a sell-side sweep an area where they bought.
Once the stops are filled, the fuel on that side is spent. Price no longer has those orders beyond the level to pull it further. The move can then turn toward the liquidity resting on the opposite side. That is why a sweep of an old low is read as a possible turn up toward the old highs. A sweep of an old high is read as a possible turn down toward the old lows.
A sweep also defines risk: the reversal idea fails once price trades through the sweep's extreme, its highest or lowest wick.
How to Anticipate a Meaningful Liquidity Sweep
Not every swept level deserves attention. The aim is to know, before price arrives, which side is more likely to be swept and why it would matter.
Start with the obvious highs and lows listed above, then read the higher-timeframe structure.
Three filters add weight to a sweep. A higher-timeframe PD array at the swept level, such as a daily order block or fair value gap, gives price a reason to turn there. The daily bias decides which side's sweep fits: a sell-side sweep below an old low in a bullish market, a buy-side sweep above an old high in a bearish one. The time of day matters too. Sweeps around session opens, such as the London open taking the Asian high or low, carry more weight than a sweep at a random hour. The ICT Venom model is built on this filter: a raid of the 08:00–09:30 New York range after the 09:30 open. Filters raise the weight of a sweep, but they never confirm it.

How Traders Use a Liquidity Sweep in Practice
In practice, a liquidity sweep is the first part of a reversal setup, not the whole setup.
Why the Sweep Alone Is Not an Entry
The sweep is context, not an entry. At the moment an old low is taken, nobody knows whether price will come back or keep running. Buying into a sell-side sweep or selling into a buy-side sweep means trading the very candle that may turn into a breakout. The sweep marks the place, displacement and a market structure shift confirm the turn, and the pullback gives the entry. If one step is missing, there is no trade.
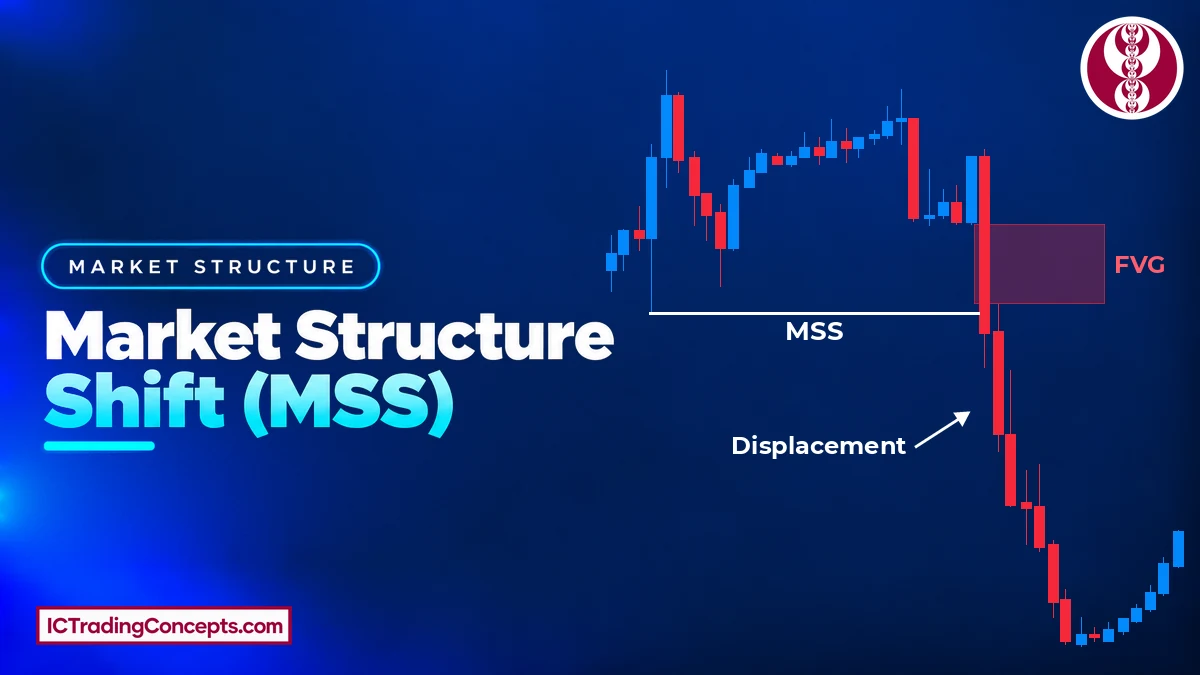
Confirmation: Displacement and a Market Structure Shift
Confirmation has two parts, and both come from the move away from the swept level:
- Displacement: a strong, decisive move away from the level, made of large candles in the new direction. Price that only drifts sideways or slowly after the sweep has not shown that the other side took control.
- Market structure shift (MSS): a candle body closes beyond the short-term swing that launched the last leg into the sweep, and that close comes with displacement. After a sell-side sweep, the body closes above the short-term swing high that started the drop into the low. After a buy-side sweep, it closes below the short-term swing low that started the rally into the high.
A wick through that swing is not enough; the body has to close beyond it. SMC traders call a similar break a change of character (CHoCH), and the closest match to the MSS is a CHoCH made with displacement.
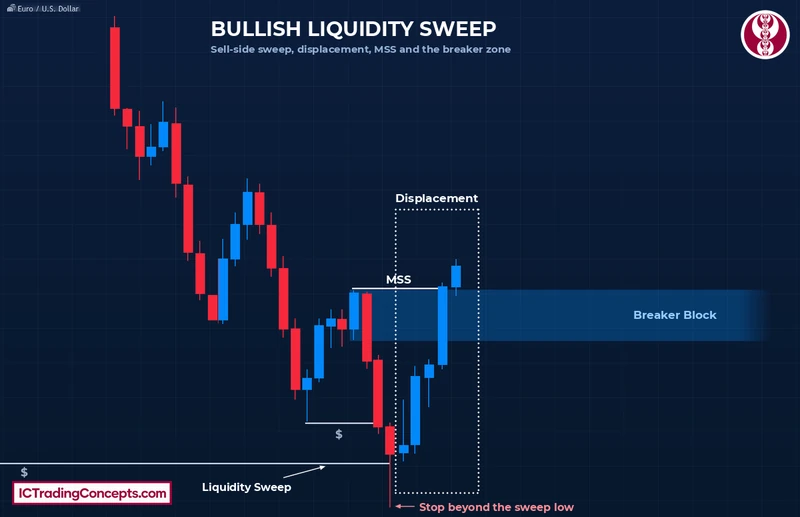
In the bullish example below, sell-side liquidity is swept and a displacement leg closes above the short-term high for an MSS. The breaker block, the failed order block that the displacement leg breaks, becomes the entry zone. The stop sits below the sweep low.


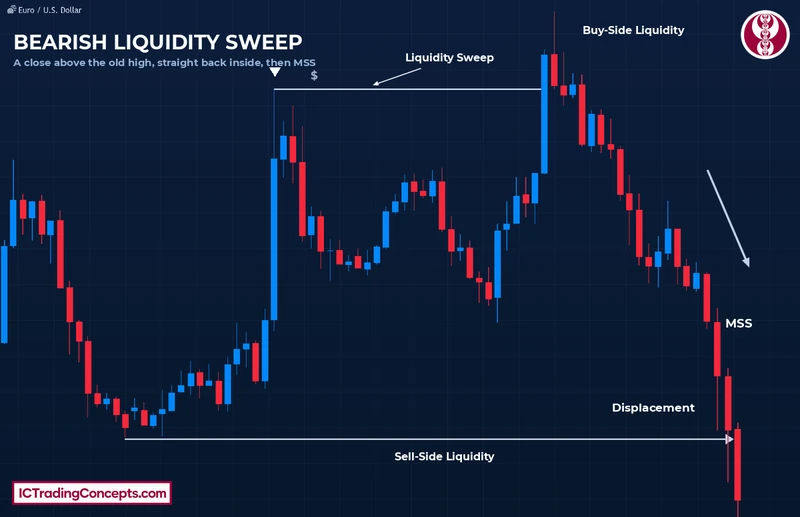
The bearish version follows the same rules at a high. In the EUR/USD example below, a candle even closes above the old high, yet price drops straight back inside. The displacement that follows closes below the short-term low, and that MSS turns the buy-side sweep into a short setup.
Entry, Stop and Target: The Trade Flow Step by Step
The trade flow below puts the pieces of an ICT liquidity sweep strategy in order. It works the same way for a bullish and a bearish sweep; only the direction changes.
- Read the bias. Use the daily and 4-hour charts to decide whether the market is bullish, bearish or neutral.
- Mark the liquidity: old highs and lows, the day's and session ranges.
- Mark the higher-timeframe PD array that price is drawn to.
- Wait for the sweep. Price trades through the level and comes straight back inside.
- Drop to a lower timeframe, such as the 5-minute or 1-minute chart.
- Wait for displacement and an MSS away from the swept level.
- Enter on the pullback into the fair value gap, order block or breaker block (a failed order block) left by the displacement, never on the sweep candle itself.
- Place the stop beyond the sweep's extreme: below the sweep low for a long, above the sweep high for a short.
- Target the opposite liquidity: the old highs above for a long, the old lows below for a short.
The stop belongs beyond the sweep's extreme, not at the swept level. The old low sits inside the sweep's wick, so a retest of that wick can take a stop placed there before the reversal gets going. The target is a liquidity level, not a fixed reward-to-risk multiple: price that has just taken the stops on one side now has the other side's stops to aim for.
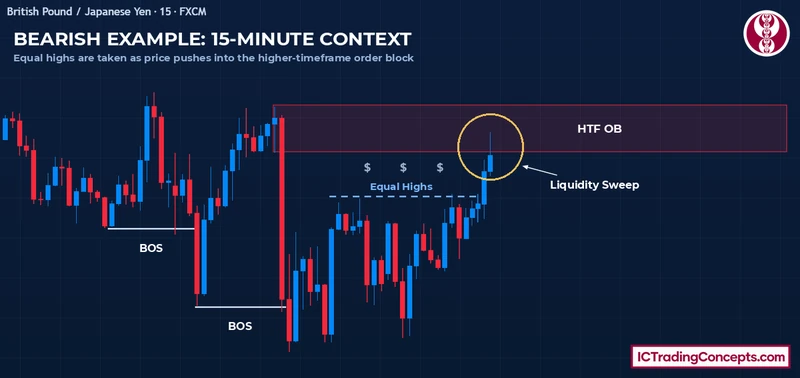
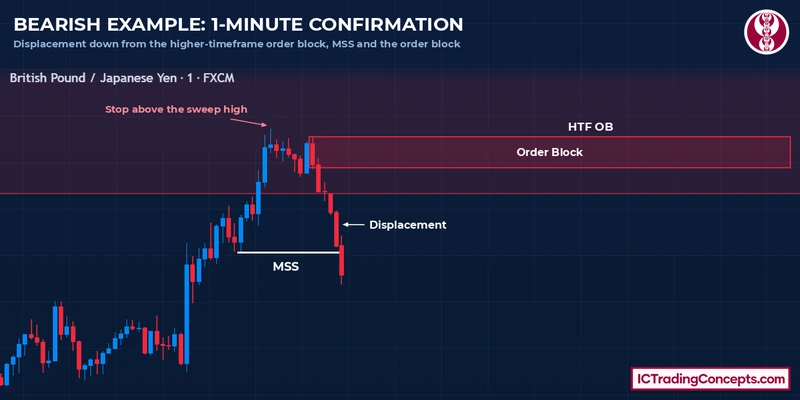
Two worked examples on GBP/JPY show this flow on real charts. In the bearish one, the 15-minute chart sets the context: equal highs sit just under a higher-timeframe order block (HTF OB), and price takes them as it trades into the zone. The buy stops above the equal highs are taken, but at this point the sweep is context, not a sell signal.


The 1-minute chart gives the confirmation. Price drops away from the zone in a series of large bearish candles, and a body closes below the short-term swing low that launched the last leg up: that close is the MSS. The order block at the top of the move is the zone for a sell on the pullback. The stop goes above the sweep high, and the target is the sell-side liquidity at the 15-minute swing low.
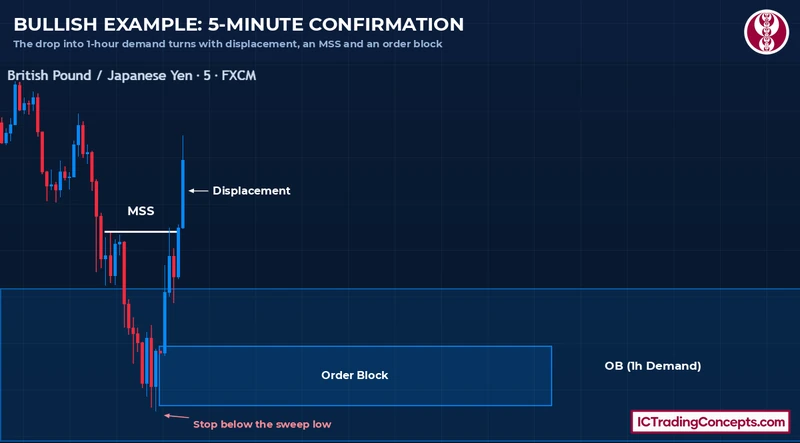
The bullish example follows the same flow from the other side. On the 1-hour chart, price sweeps a set of equal lows and drops into a 1-hour demand zone, an order block. On the 5-minute chart below, the drop stops inside that zone. A displacement leg then closes above the short-term swing high that started the last leg down, which is the MSS, and leaves an order block at the low. The long waits for the pullback into that order block, the stop goes below the sweep low, and the target is the buy-side liquidity above the old highs.
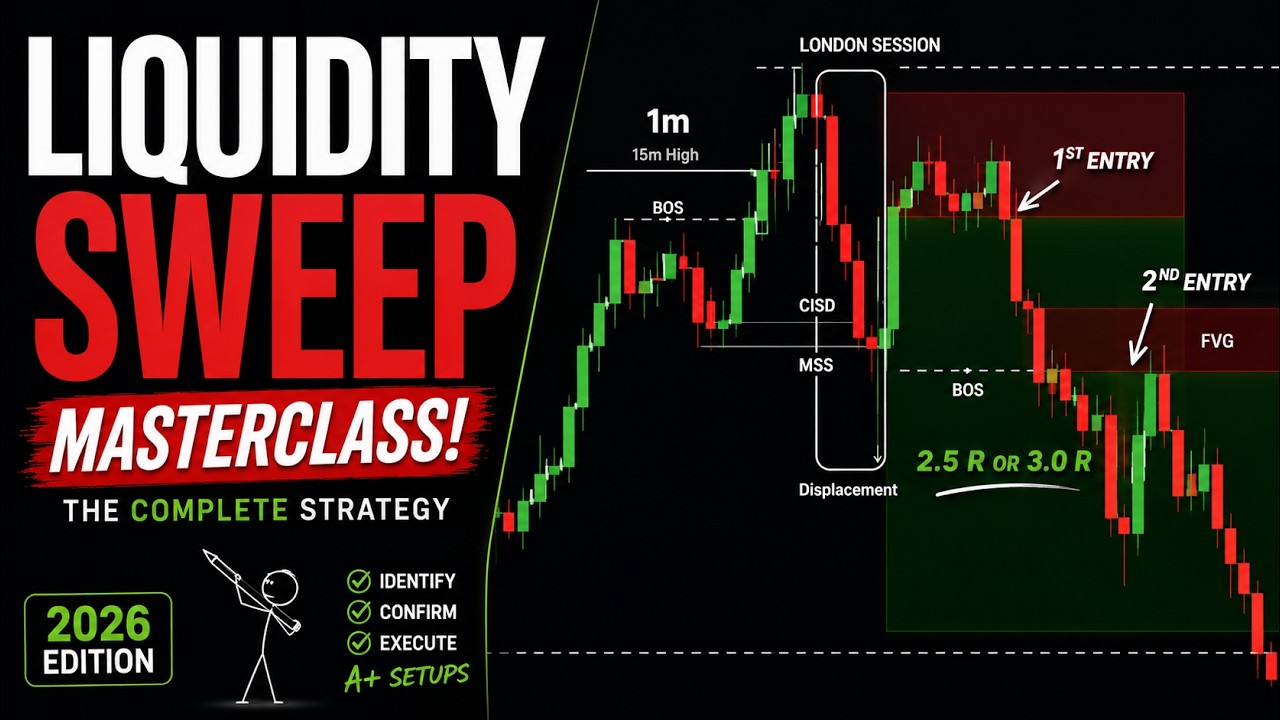
The video below shows a liquidity sweep in forex on session charts. It covers the Asian range, sweeps at the London and New York opens, and the displacement and market structure shift that confirm the turn.
Is There a Best Timeframe for Liquidity Sweeps?
There is no single best timeframe. A liquidity sweep follows the same rule on every chart: an obvious high or low is taken and price fails to stay beyond it. What changes is the job of each timeframe.
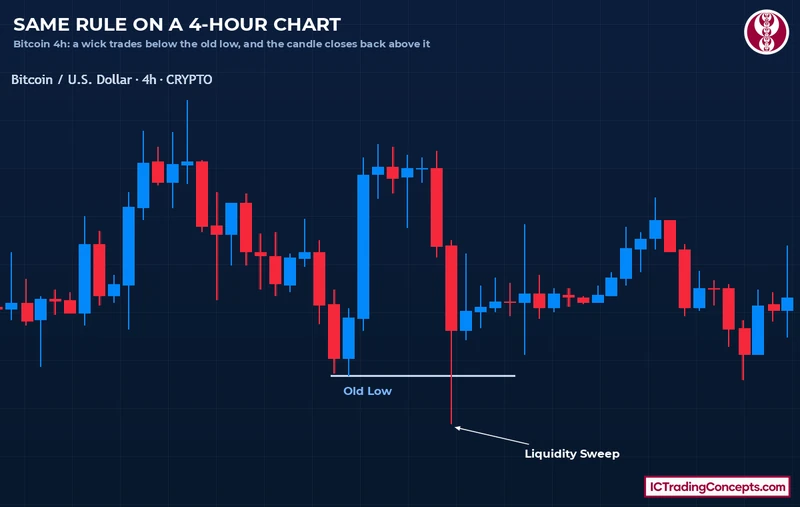
Mark the level on a higher timeframe, where the obvious highs and lows are easy to see. A 15-minute chart shows session highs and lows clearly. Then take the confirmation on a lower timeframe, such as the 5-minute or 1-minute chart, where the displacement and the MSS appear first. A sweep of a higher-timeframe level usually carries more weight than a sweep of a small swing on a 1-minute chart, because more traders watch that level and place their stops beyond it.
Common Mistakes
Most errors around a liquidity sweep come from acting too early or from reading the wrong level:
- Entering on the sweep candle. The wick that takes the liquidity is not the entry. The entry comes on the pullback after displacement and the MSS.
- Calling every break a sweep. If price closes beyond the level and holds with follow-through, it is a breakout or a run.
- Skipping the MSS. Without a body close beyond the short-term swing, the sweep is only context, not a confirmed reversal.
- Placing the stop at the swept level, where a retest of the sweep's wick can take it.
- Trading against the bias. Taking a level against the higher-timeframe bias can turn into a run; do not assume a quick return.
- Marking levels nobody watches. A minor swing in the middle of a range, a trendline or a round number holds far fewer stops than an obvious old high or low.
Liquidity Sweep Indicators on TradingView
A liquidity sweep indicator can mark the levels and flag sweeps as they happen. It does not replace the confirmation step, so read its signals with the same rules as above.
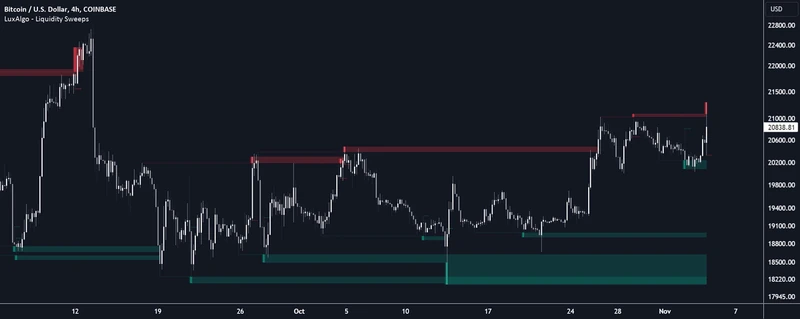
Liquidity Sweeps [LuxAlgo]
Marks liquidity levels at swing highs and lows and flags a sweep when a wick passes a level and price returns, drawing a sweep area at that spot. Useful for seeing where buy-side or sell-side liquidity was taken on any timeframe.
View on TradingView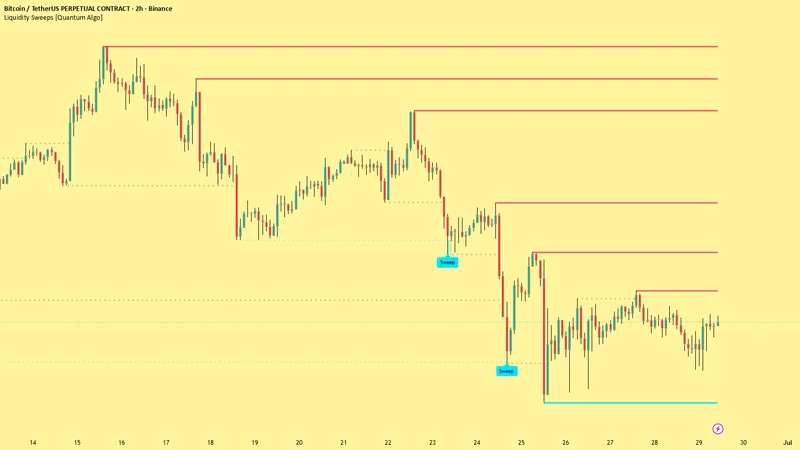
Liquidity Sweeps [Quantum Algo]
Marks confirmed swing highs and lows as liquidity levels that extend to the right until price reaches them. A candle that wicks through a level and closes back inside gets a sweep label. The script treats a full close through the level as a break and gives no signal, so a close beyond that comes straight back has to be read by eye.
View on TradingView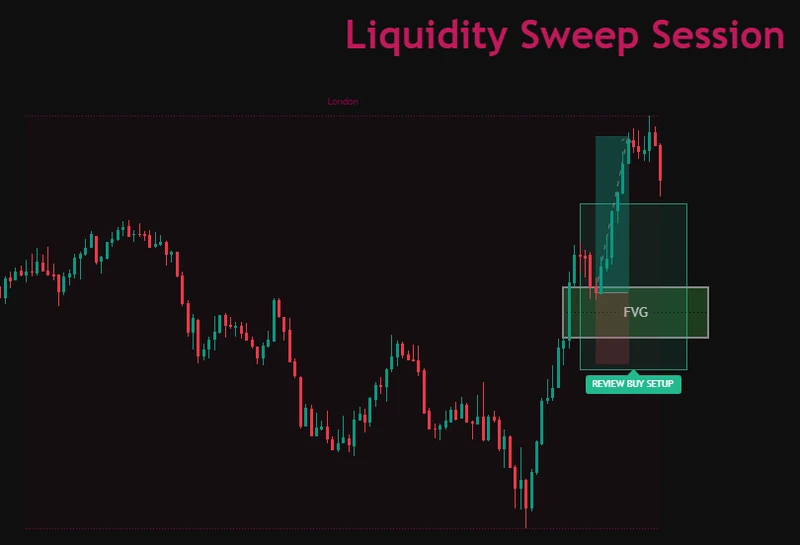
Liquidity Sweep Session [TradingFinder] ICT Killzone Times
Marks the Asia, London and New York session highs and lows, then waits for a sweep of the previous session's level, a reclaim back inside and displacement before it marks a review zone. Acceptance beyond the level is treated as a possible breakout, not a reversal.
View on TradingViewTest Your Liquidity Sweep Knowledge
Eight quick questions on where stops rest, a wick or a close beyond the level, a sweep versus a breakout, displacement and the MSS, and where the stop and target go. Each answer links back to the section that explains it.
ABCD Answer with your keyboard
-
01What makes a move a liquidity sweep rather than just a break of a level?
A liquidity sweep has two parts: an obvious level is taken and its stops are filled, then price fails to hold beyond it. A move that does only the first part is not a sweep. Review: What Is a Liquidity Sweep in Trading?
-
02Where do the buy stops rest that a buy-side liquidity sweep takes?
Short sellers protect their trades and breakout buyers enter above old highs and equal highs. That cluster of buy stops is buy-side liquidity. Review: Where the Stops Rest Before a Sweep
-
03A candle closes above an old high, and the next candles drive straight back below it. How does this page read it?
A close beyond the level does not cancel the sweep. What matters is that price does not stay beyond the level and is back inside on the same candle or within the next few. Review: Wick or Close: Does a Liquidity Sweep Need a Close Back Inside?
-
04Price closes beyond an old low and holds there with follow-through. What is it?
When price holds beyond the level with follow-through, the stops were taken but the move did not fail. That is a run or a breakout, not a liquidity sweep. Review: When Price Holds Beyond the Level, It Is Not a Sweep
-
05Why is the sweep candle itself not an entry?
The sweep is context, not an entry. Buying into a sell-side sweep or selling into a buy-side sweep means trading the very candle that may turn into a breakout. Review: Why the Sweep Alone Is Not an Entry
-
06After a sell-side liquidity sweep, what counts as the market structure shift (MSS)?
The MSS is a candle body close beyond the short-term swing that launched the last leg into the sweep, and it comes with displacement. A wick through that swing is not enough. Review: Confirmation: Displacement and a Market Structure Shift
-
07Where does the stop go on a long after a sell-side liquidity sweep?
The stop belongs beyond the sweep's extreme. The old low sits inside the sweep's wick, so a retest of that wick can take a stop placed at the level. Review: Entry, Stop and Target: The Trade Flow Step by Step
-
08What does a liquidity sweep trade target?
Price that has just taken the stops on one side has the other side's stops to aim for. The target is a liquidity level, not a fixed reward-to-risk multiple. Review: Entry, Stop and Target: The Trade Flow Step by Step
Review your answers
Conclusion
A liquidity sweep is a quick move beyond an obvious high or low that takes the stops resting there and fails to stay beyond the level. A wick is enough, and a close beyond still counts when price comes straight back. If price holds beyond the level with follow-through, it is a run or a breakout instead.
Treat the sweep as context and wait for displacement and a market structure shift. Then enter on the pullback into the FVG, order block or breaker block, keep the stop beyond the sweep's extreme and aim at the opposite liquidity. The sweep shows where to look; the confirmation decides whether to trade.
Sources
- Breakout defined as price passing through a level and staying through it: Wikipedia
- Institutional investors such as banks, pension funds and endowments: Wikipedia
- Liquidity sweeps at session opens, displacement and MSS (forex session examples): Smart Risk, YouTube
Be the first to share your thoughts on this article.